Interactive Visual Machine Learning
Our main idea is to explore how visualization with interactions [1] could improve the efficiency of communications between human and machine learning: how could interactive visualization could help users create machine learning algorithms effectively and efficiently. Finding and exploring items with characters that hard to express in keywords is still a hard problem. 'Interactive concept learning’ is an excellent solution that provides personalized recommendations based on concepts learned through users' selected examples interactively. However, it could still be time-consuming if labeling elements itself is a hard task, since only with enough numbers of labels could the machine learning generate a good concept learner. In the era of big data, finding and recommending the most interest and valuable subset from large collections is a hot research topic and has been explored a lot as the distance metrics problem: recommendation systems, information retrieval, and so on. When talking about finding and recommending the customized, on-demand group of abstract elements/ that is hard for users to express or describe through natural language, current research techniques are too clumsy to solve it.
Click here to go to the real demo.
RELATED WORKS
Before our own design, we have explored the topic through both HCI and machine learning fields, and make a list of comparison of current research in HCI and Machine Learning.
1. Machine Learning:
The topic of effective machine learning creation has been explored in different perspectives in the machine
learning fields: Active learning [2] tries to using less but the most valuable labels that provides the
greatest information gain, evaluating effectiveness and efficiency as the numbers of examples users should
label. Machine teaching [3] is an optimization problem over teaching examples that balance the future loss
of the learner (machine learning algorithm) and the effort of the teacher. Interactive machine learning [4]
tries to improve human teacher by giving teachings guidance, when human training an agent to perform a
classification task by showing examples. The interactive machine learning also tries to improve the
effectiveness of classifier creation through the efficiency of labeling. The guidance for users could
improve the labeling efficiency based on provides users more information, the context about labeling could
let users labeling quickly than labeling less examples without any context.
Since current research on interactive machine learning are mainly works on how to provides users guides
based on different presentation techniques based on ranking or neighbors. For our project, we plan to
provides more context through visualization and let users labeling and explore dataset interactively.
2. Visual Analytics:
Visual analytics [5] aims at providing visual platforms for users to interact directly with data and models through combining the power of automated data analysis and mining. Visual analytics researchers mainly explore the topic through how to make users effectively expressing their knowledge and preferences visually and interactively to data mining or machine learning methods. The visual classifier training model [6] presents an approach for building classifiers interactively and visually: how classifiers can be trained in a visual and interactive manner to improve recall and generalization for searching and filtering tasks in visual analytics scenarios. The Visual Classifier Training model mainly works on how to build classifiers interactively and visually in order to complement classical supervised machine learning techniques.
Our project is also about creating a visual classifier training model, but providing more guidance based on interactive machine learning instead of active learning. We will also try to explore how different visualization layout could affect the labeling effect.
PROGRESS
We got our idea of interactive machine learning powered with interactive visualization based on the combination of the visual classifier training model and Effective End-user Interaction with Machine Learning [7]. How could we interact with supervised machine learning in an observation level effectively - letting users explore big dataset and label items, sense-make current machine learning state in on visualization workspace. Instead of using several different visualization views to present the quality of the classifier, the status of the classifiers, the contents of the labels, we create only one visualization view (workspace) to let users explore the dataset and express their preference, and also let classifier re-layout the view to express the status, the quality of the classifiers.
1. Semantic Interaction
To let users express their knowledge and preference even without any prefessonal knowledge on machine learning, and at the same time, mapping users' interactions (that expressing knowledge and preference) into inputs to tranings clasisifers, we mappings users interactions to control machine learnings models through semantic models, in a different way. However, different from traditional semantic interactions, we use semantic interactions for classifiers: that mappings the X axis into the certainty of samples that belong to each part. At the same time, the trained classifier could also be mapped to visualization to show the confidence on the X axis.
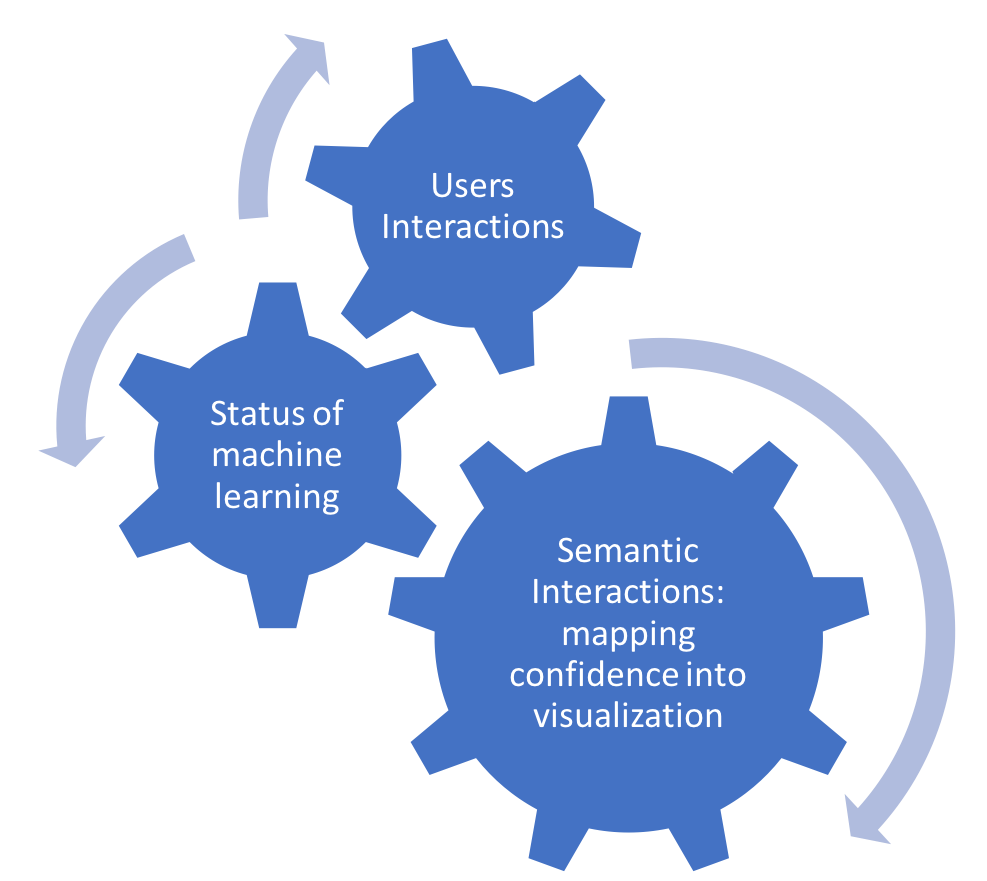
2. Interactive Machine Learning
Based on the framework of interactive machine learning, the most basic interactive machine learning algorithms used in academic research is 'nearest-neighbor classifier' [9]: through re-rank samples with or without specific features, which could present examples illustrating its current understanding of the desired classifier and users use this presentation to decide how to further improve the system's understanding. To make our IVML model simple for implementation and demonstration, like the framework of interactive machine learning, we use the basic linear SVM from Scikit-Learn lib, of Python. Each time, the model maps user's interactions into interactive machine learning part, we will update the linear SVM again.
3. Interactive Visualization
For the basic visualization part, we will use the web-based version of StarSPIRE [10] that Yali Bian developed to visualize the text documents based on ForceSPIRE [10]. However, more interactions will be added to help users explore examples with context generated based on interactive machine learnings. As we talked on semantic interaction part, certainty of samples should be labeled to X axis. Basic on this semantic meaning of 2D screen, we resigned our visualization as follows:
The most basic and expressive interaction that users could use is dragging: user could drag samples to the position that he/she think it should be: if the user is super confident about the samples that belongs to the negative part, he/she could drag the sample to left that far away from the certor, the most uncertain place, that most samples located at, at first. The distance from the centor could be directly mapped to the confidence of the label that user makes. The left part with green background color means negative part for samples, right part with red background color means the positive part. Samples at the center blur part means users or classifier are not sure which part should the sample belong to.
There are other interactions for users to manage labels in a higher level:
- Update Layout: parse current layout and passings labels back to interactive machine learning part, and update the layout based on trained classifier.
- Undo Layout: undo the last training, and update the layout based on last trained classifer.
- Reset Layout: clear all the labels for the interactive machine learning part, and update the layout based on classifier with 0 labels.
- Undo Label: un-label the last dragged sample.
- Redo Label: re-label the last un-labeld sample.
Case Study
To test the effectiveness and effencity of our model, we perform an case study based on animial dataset on classification between herbivore and carnivores. The results show that even without any knowledge about machine learings, commom users still could training a great classifier for personal usage.
Animal Dataset
We choose to use the animal dataset for two reasons:
- The dataset of animals could be easily understand by users through only animal names.
- The dataset of animals could be explored in different groups.(Prey and predator, land/water types, etc)
- The dataset (50*86) is really small set (50 animals) but with enough features (86), which is easy to visualize and explore for users, at the same, proviving enough features to do an accurate classification.
First Layout and First Interaction
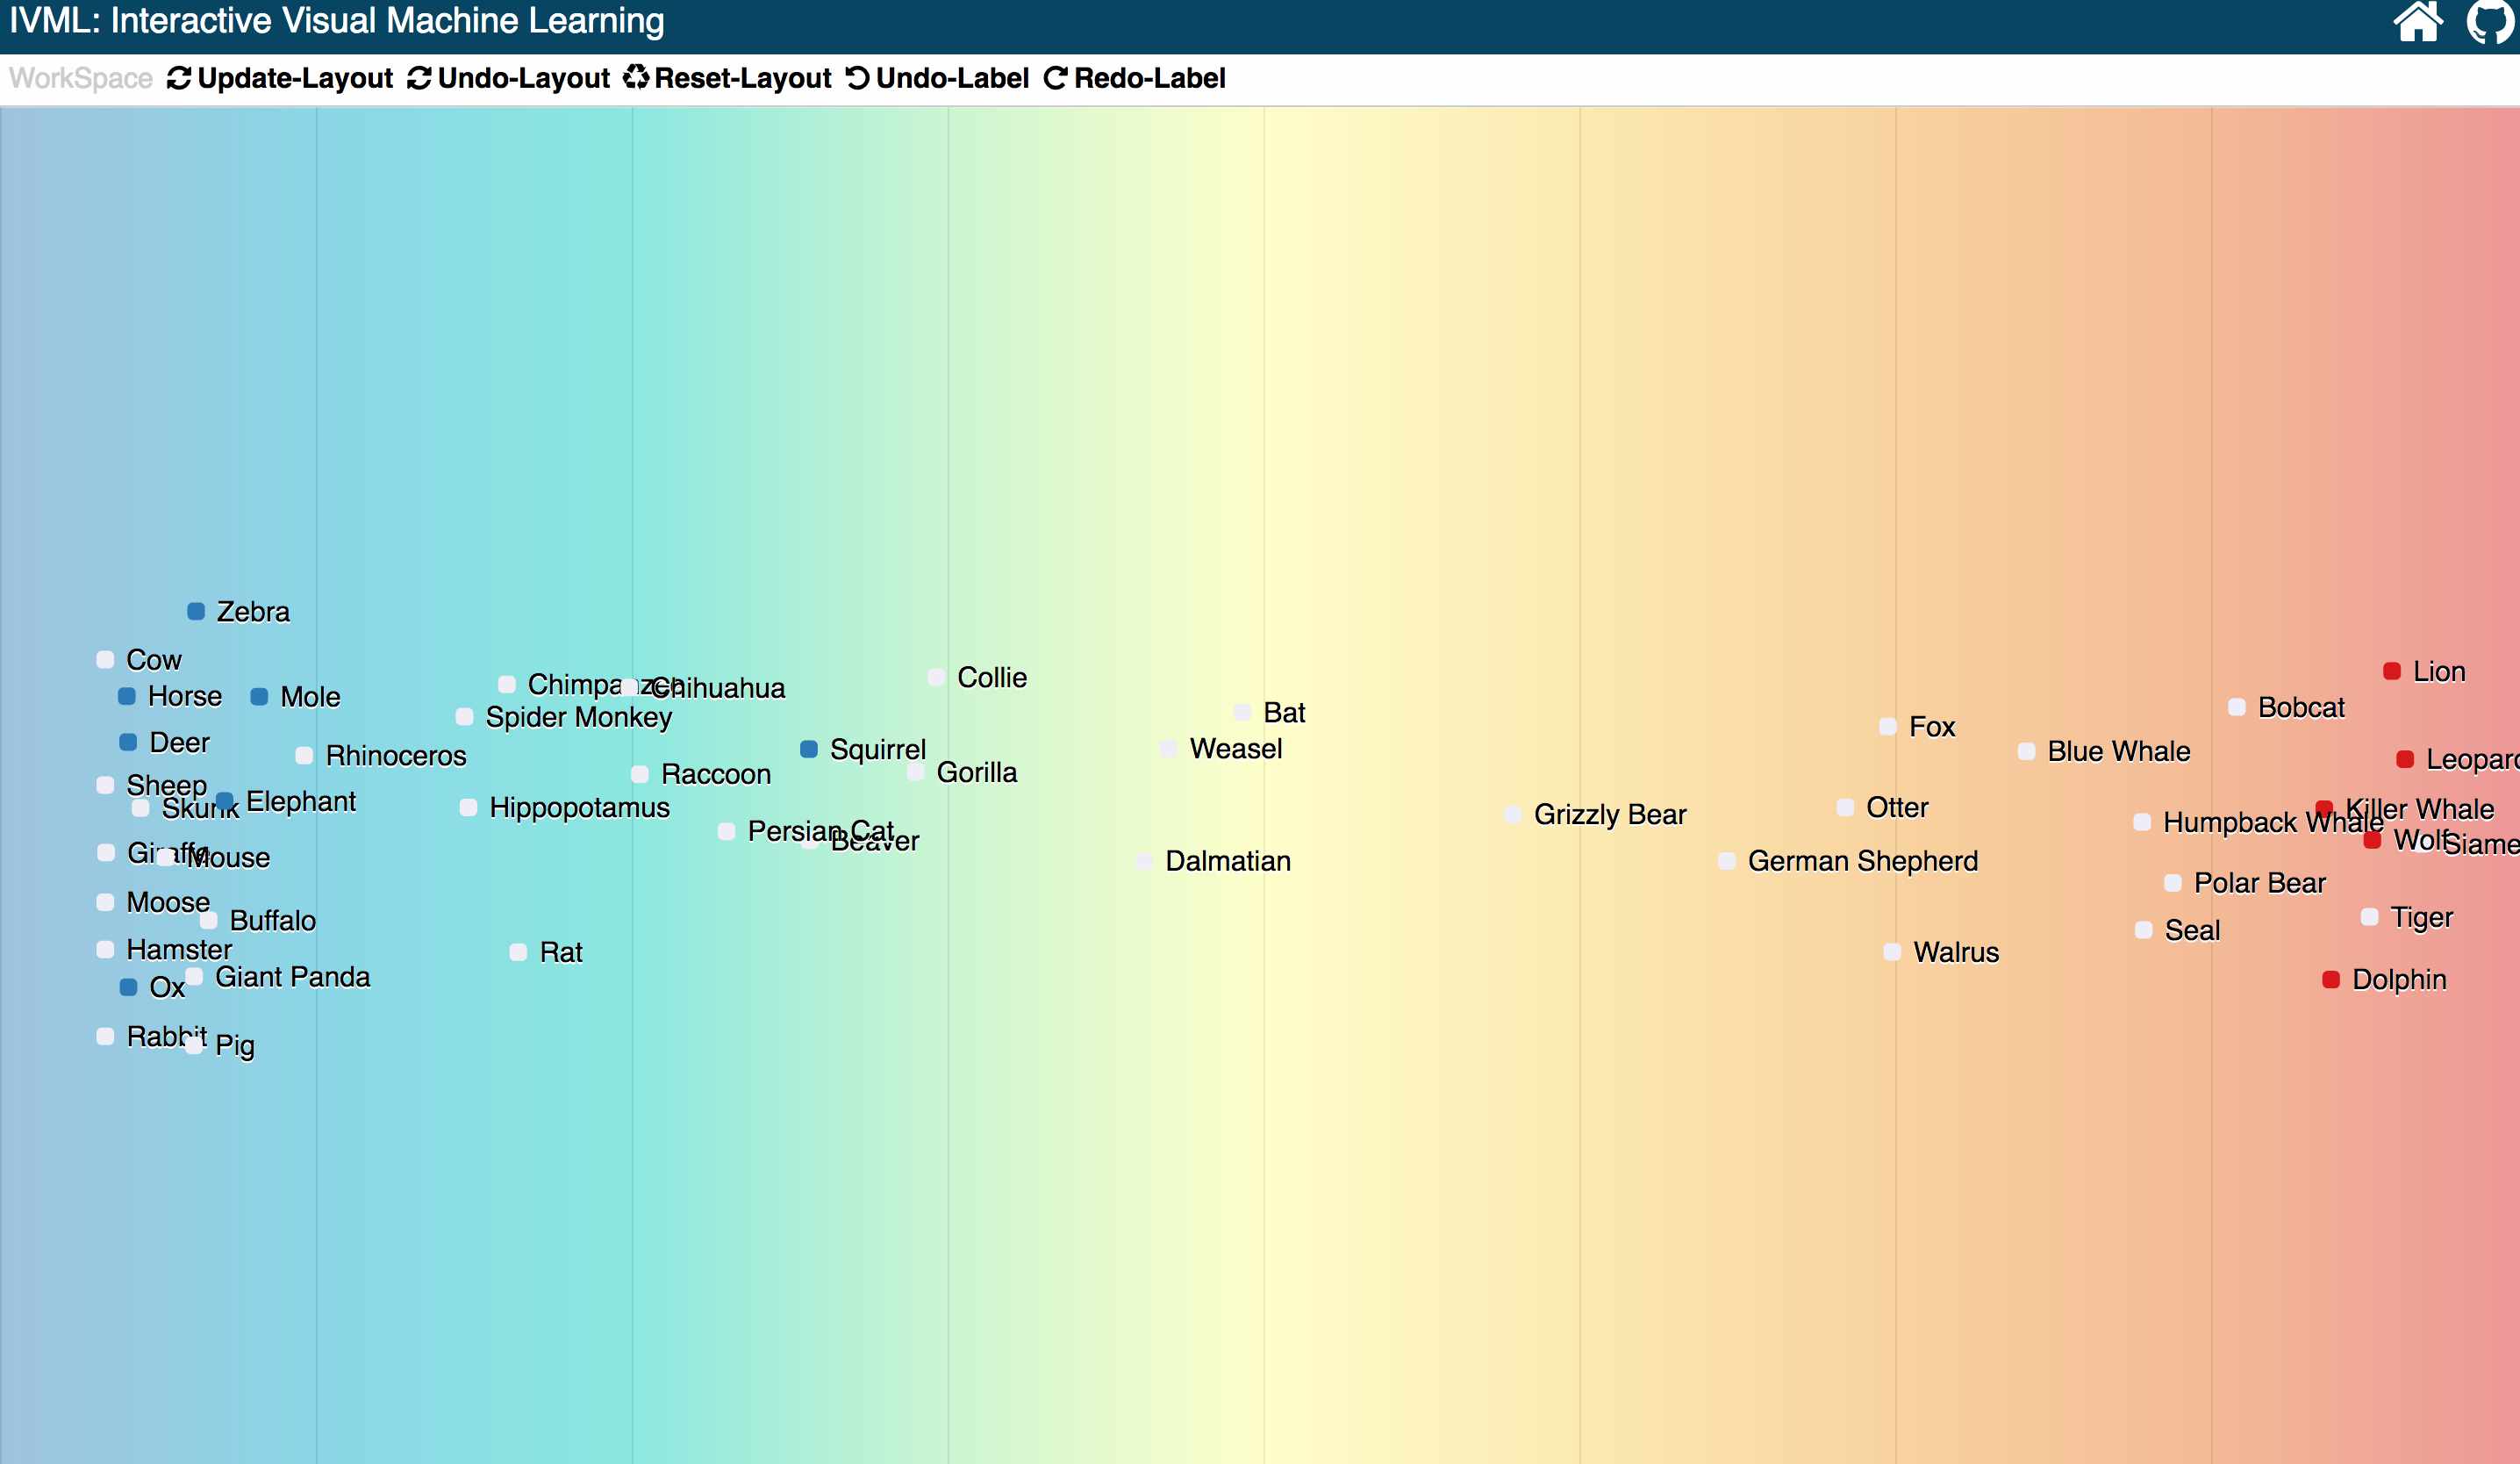
At first, since there is no labels to trainer the classifer, so all the samples located at the center part.
When the user tries to classify two types of animals: herbivores, carnivores. The user first, drag three obvious herbivorious animals into the left part, that far away from center, and three obvious carnivorious animals to the right far away from center.
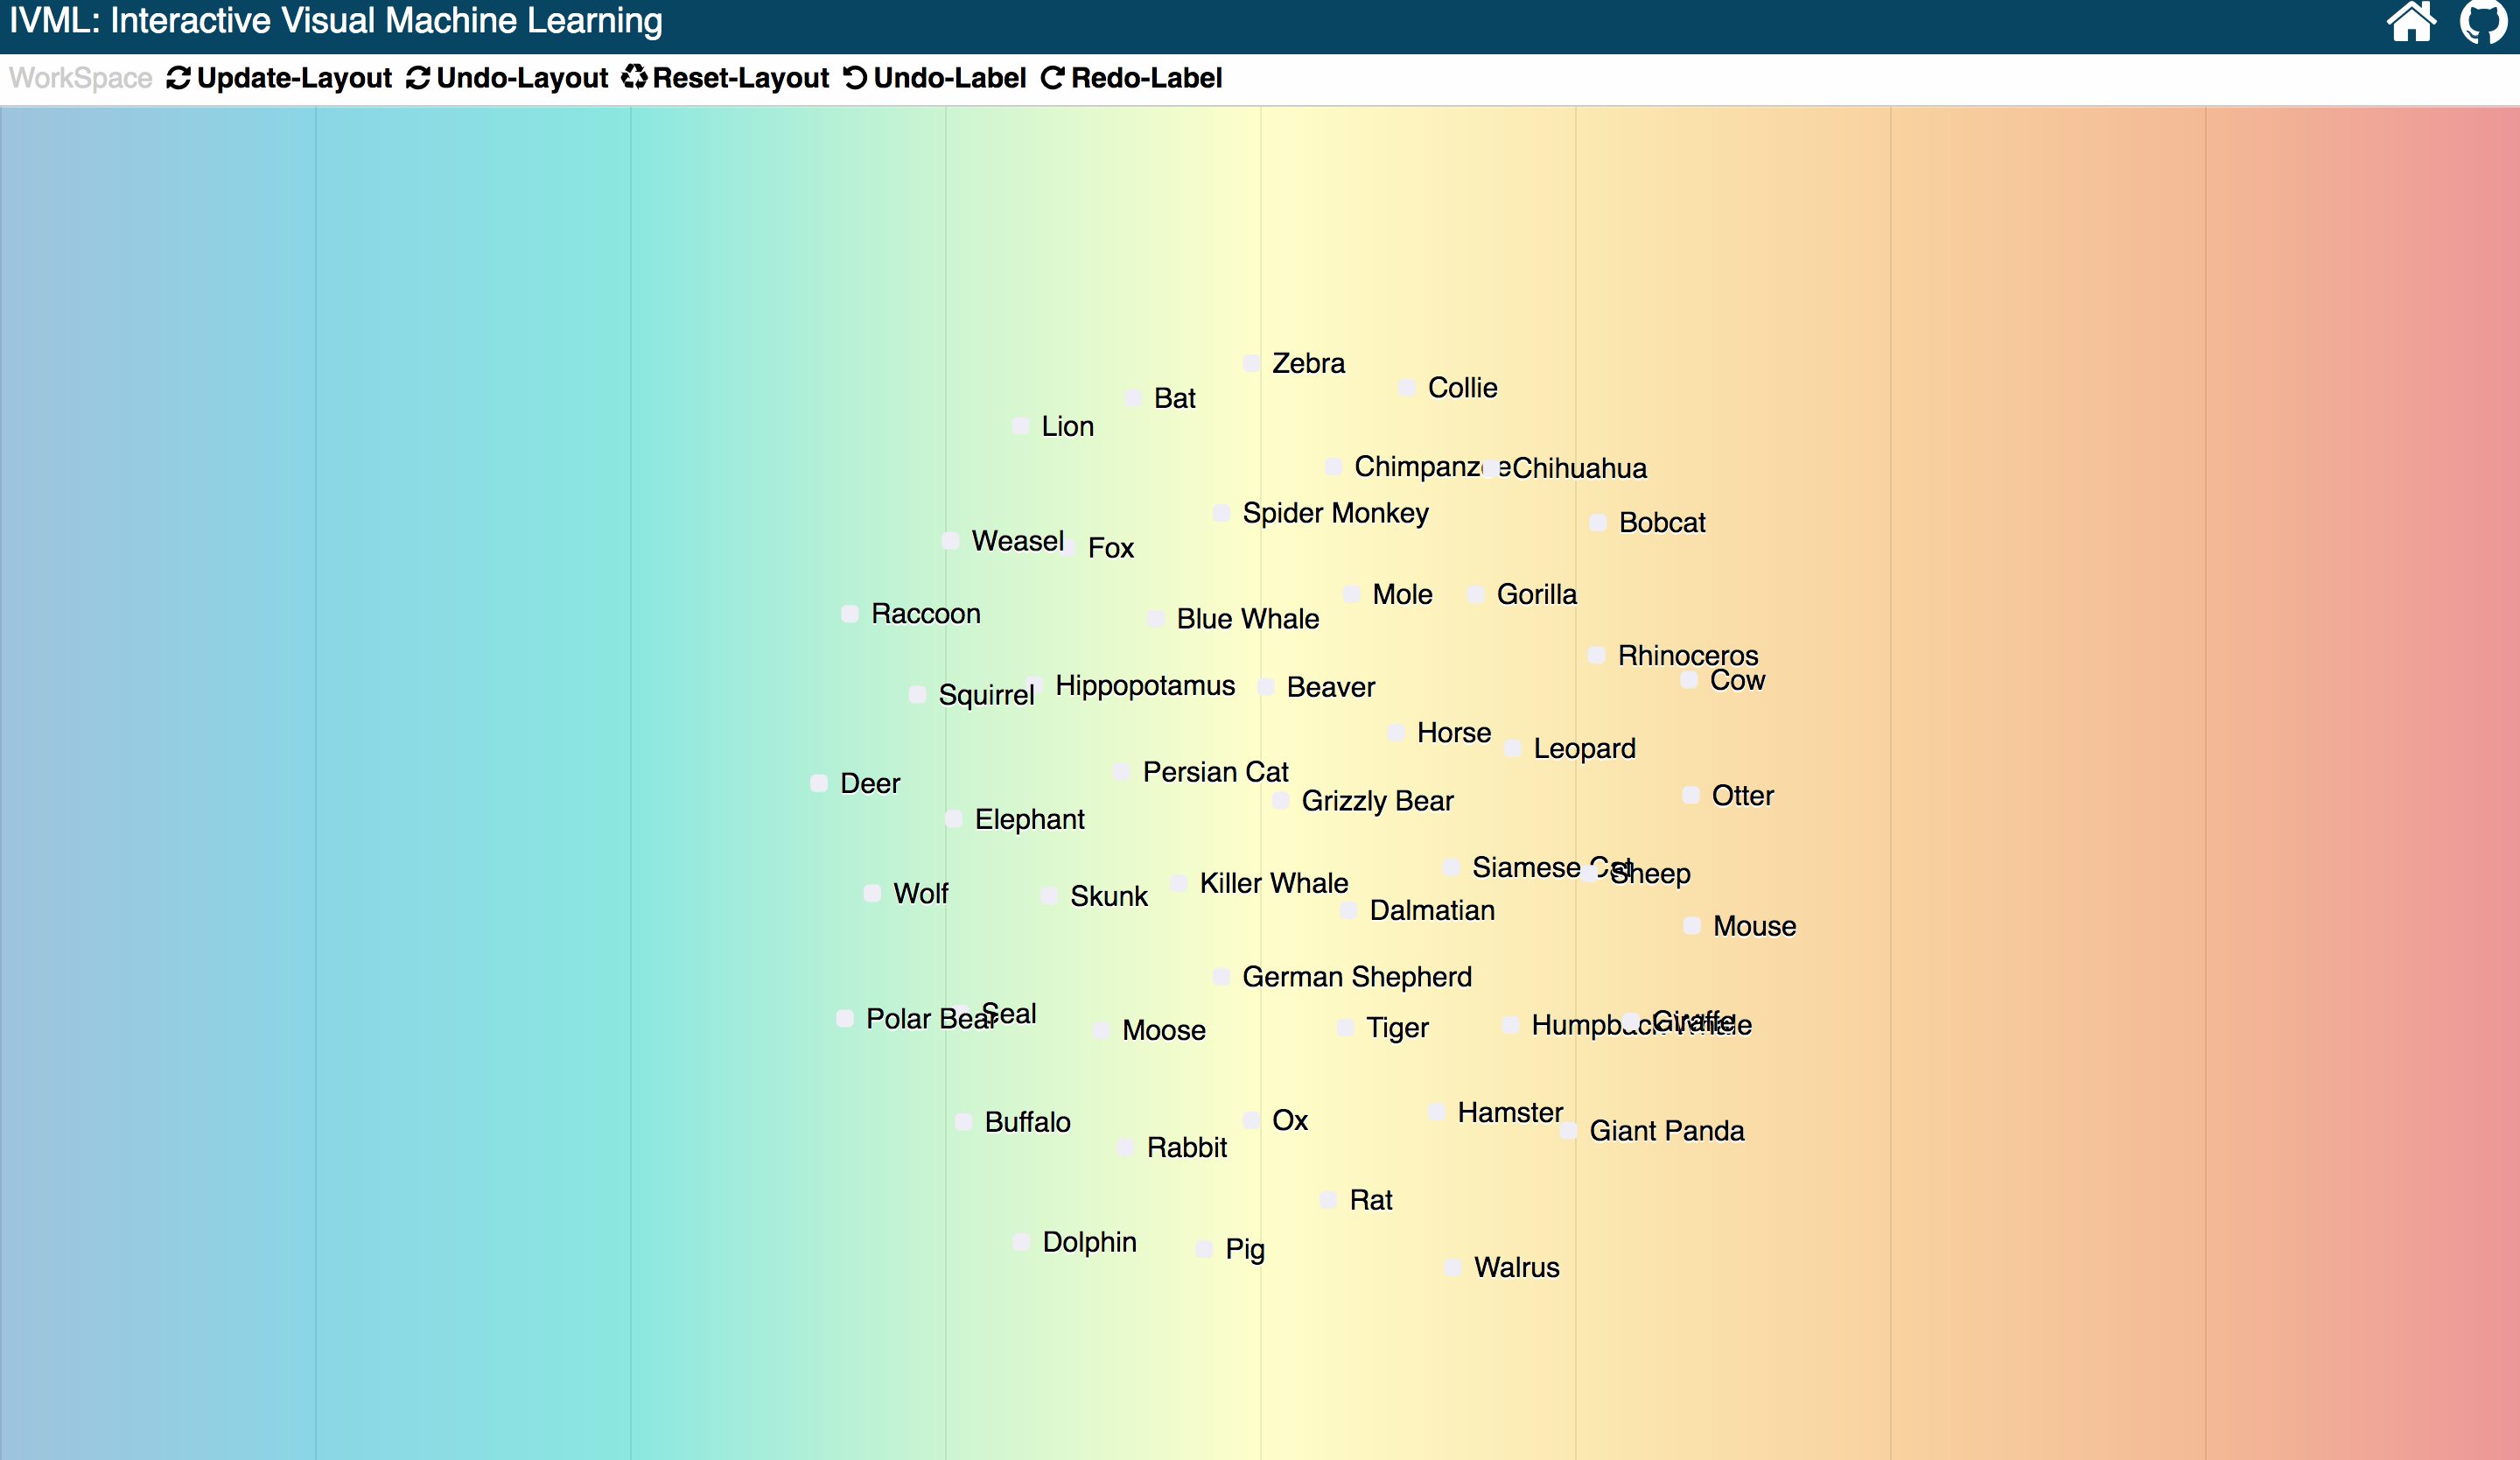
Then the user click the Update-Layout button, to train the classifier using those six samples. Then the visualization updated based on new updted classifier.
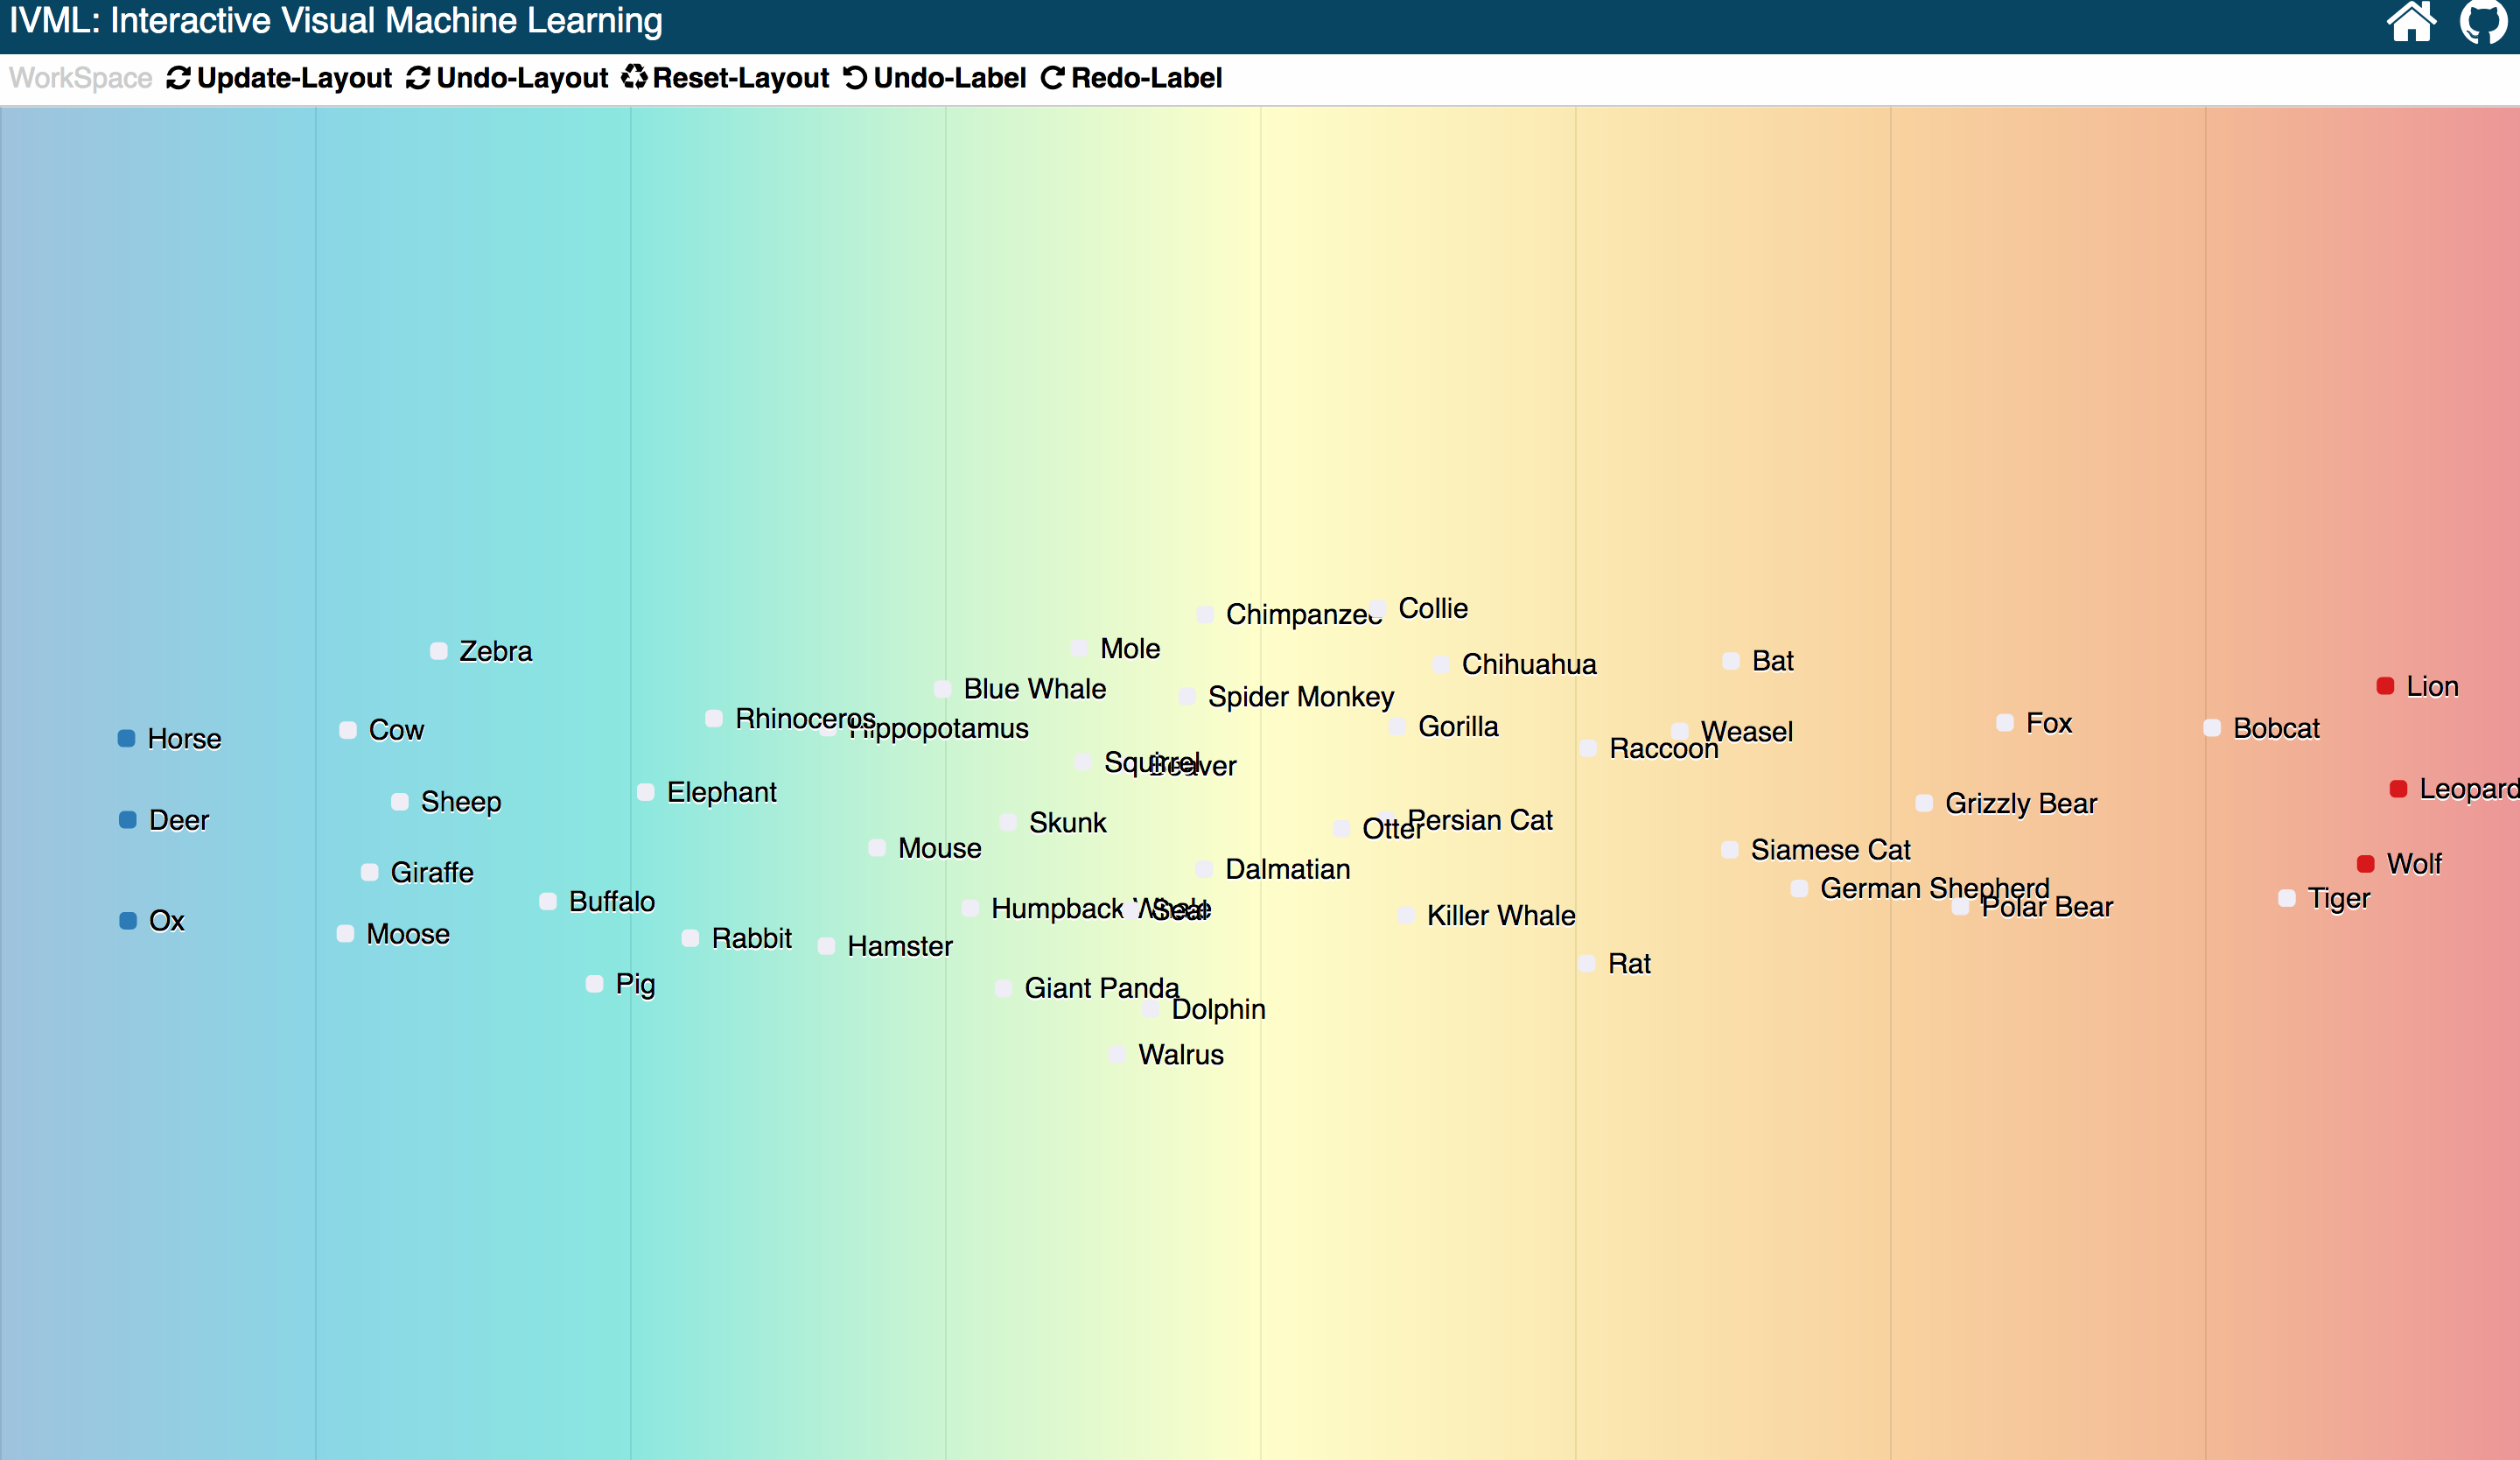
Current layout of visualization shows current status of the updated classifer, half of the animals has been successfully classified into two sides. There are still half animals like dolphin and killer whale, etc. The user just drag more other samples to two sides and update the layout again.
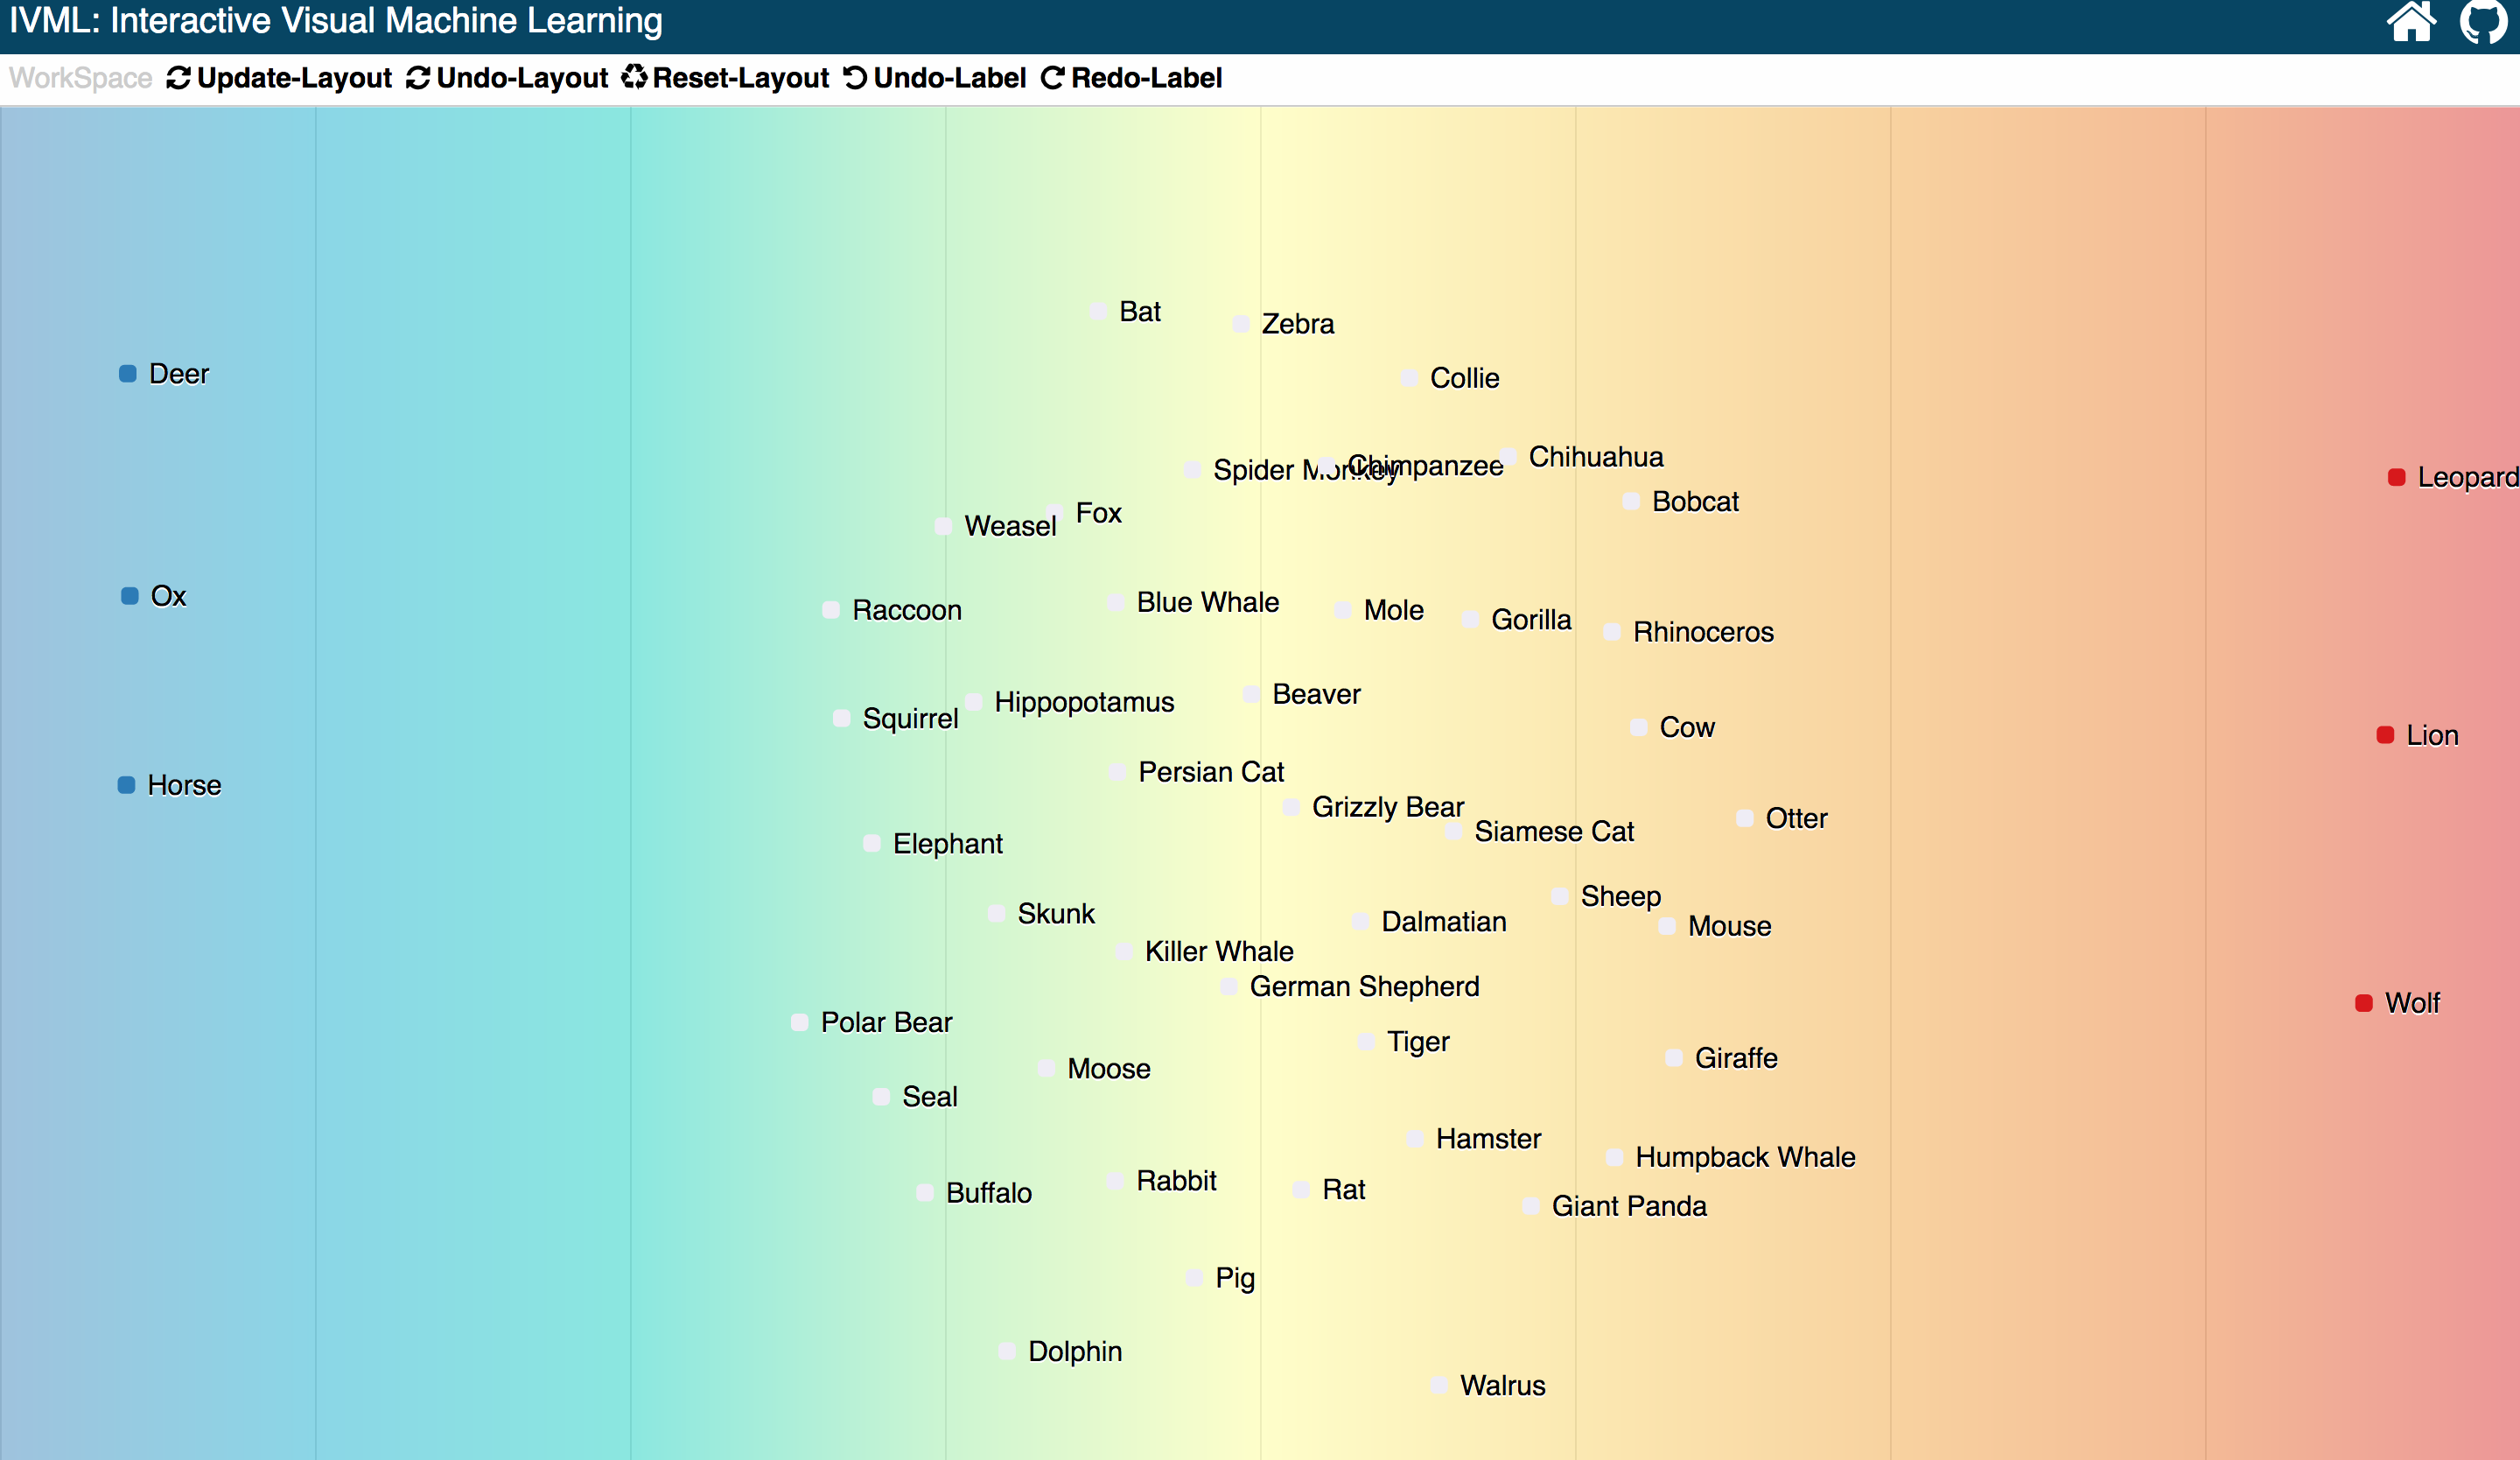
After the second training, the new updated visualization based on current classifier, shows only three unconfident samples located at the certer.
Based on those interactions, human in the loop, we proved that users without any knowledge about machine learning, could still train a clasifier easily an quikcly.
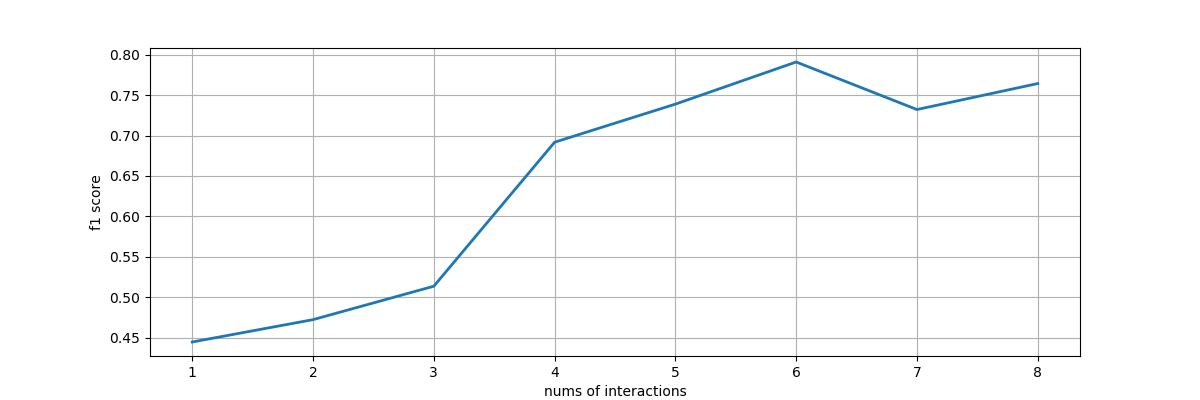
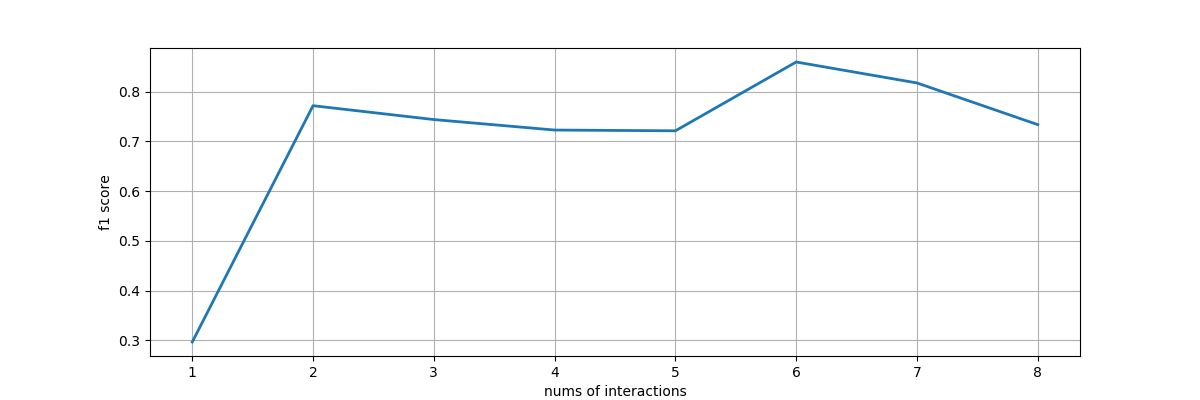
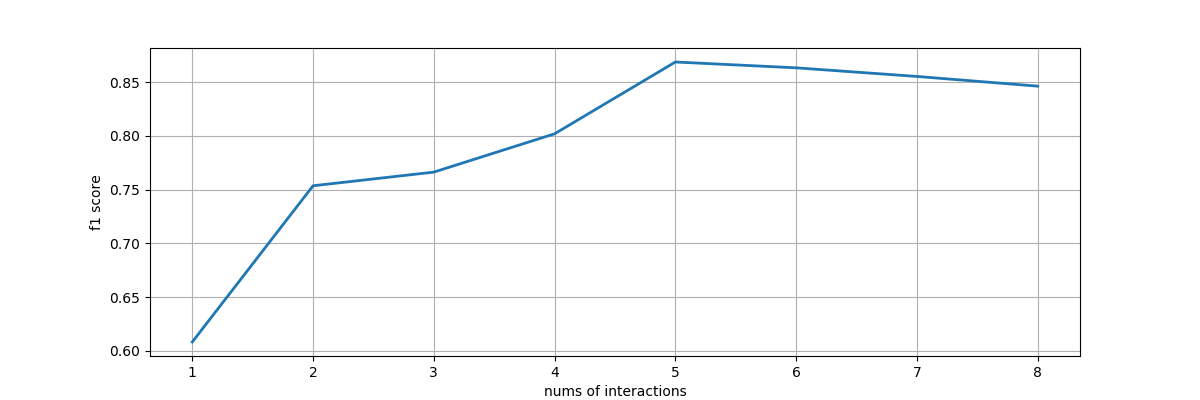
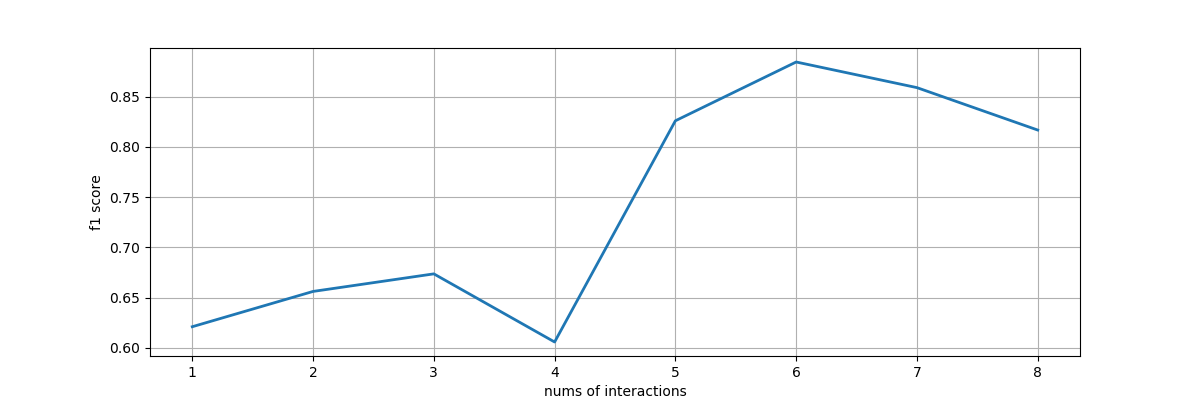
Evaluations
To evaluation the underlying interactive machine learning model, we design an interacitve machine learning model with mimic interactions from users. Each time, users could label only two examples, one from the negative part, and one from the positive part. Then using other unseleted samples as test set, and calculate the f1 score and plot out the status. We trained classfiers to evaluate the underlying model: domestic and wild animals, animals with horns or not, prey and predator, animals lives in water or land.
Basted on the four f1-score line chart, we could find non-expert users on machine learning could successfully train classification models for their own usage
REFERENCES
- J.J. Thomas and K.A. Cook, eds., Illuminat- ing the Path: The Research and Development Agenda for Visual Analytics, Nat'l Visualization and Analytics Center, 2005.
- B. Settles, Active Learning, Morgan & Claypool, 2012.
- Simard P Y, Amershi S, Chickering D M, et al. Machine Teaching: A New Paradigm for Building Machine Learning Systems[J]. arXiv preprint arXiv:1707.06742, 2017.
- Fails, J.A., Olsen Jr., D.R. Interactive Machine Learning. IUI 2003, 39-45.
- J.J. Thomas and K.A. Cook, eds., Illuminat- ing the Path: The Research and Development Agenda for Visual Analytics, Nat'l Visualization and Analytics Center, 2005.
- Heimerl F, Koch S, Bosch H, et al. Visual classifier training for text document retrieval[J]. IEEE Transactions on Visualization and Computer Graphics, 2012, 18(12): 2839-2848.
- Amershi S. Designing for effective end-user interaction with machine learning[C]//Proceedings of the 24th annual ACM symposium adjunct on User interface software and technology. ACM, 2011: 47-50.
- http://qwone.com/~jason/20Newsgroups/
- Cover T, Hart P. Nearest neighbor pattern classification[J]. IEEE transactions on information theory, 1967, 13(1): 21-27.
- Bradel L, North C, House L. Multi-model semantic interaction for text analytics[C] Visual Analytics Science and Technology (VAST), 2014 IEEE Conference on. IEEE, 2014: 163-172.