VISO: visualize optimization algorithms for objective functions
Github Demo
The optimization algorithm is one of the most important concepts in deep learning to optimize neural networks. people can get various optimization algorithms in every deep learning library easily. These algorithms, however, are often used as black-box optimizers. Thus, it's a little difficult to understand every algorithms strengths and weaknesses. We try 6 different optimization algorithms on different objective functions (convex, non-convex) with detailed visualizations and diagnostics. We hope this would help people comprehend the behavior of different optimization algorithms intuitively and put the algorithms to use in the certain environment.
Related Work
Before we start the project, we read some relevant papers. Sebastian Ruder in ”An overview of gradient descent optimization algorithms” [8] provides the behavior of different algorithms that will allow using. This paper looks at different variants of the optimization algorithm, introduces the most common optimization algorithms and investigates additional strategies for optimizing gradient descent. It's pity that in its visualization part, there are 2D figures and they cannot interact with users (The paper also post in the author's website). "An Interactive Tutorial on Numerical Optimization"[6] is a pretty good example of visualizing optimization algorithms. However, we find it doesn't conclude some popular algorithms, such as Adagrad, Adam, and BFGS etc.
In addition to the above two articles. What is worth challenging is the learning rate. If learning rate is too small, it would lead slow convergence. If learning rate is too large, it may hinder convergence and cause the loss function to fluctuate around the minimum or even to diverge. So we hope to find a right learning rate for each algorithm. What's more, we may not want to apply same learning rate to all parameters when the data is sparse and the features have different frequencies. Meanwhile, we would hope to update the learning rate for particular ones of them.
Our Work
For this project, we build a GUI that compares different optimization algorithms on different objective functions (convex, non-convex) with detailed visualizations and diagnostics.
Implemented optimization algorithms include:
- Gradient Descent
- BFGS
- Nesterov accelarated gradient
- Adagrad
- Adam
- RMSprop
Objectives types to be tested with:
- convex
- non-convex
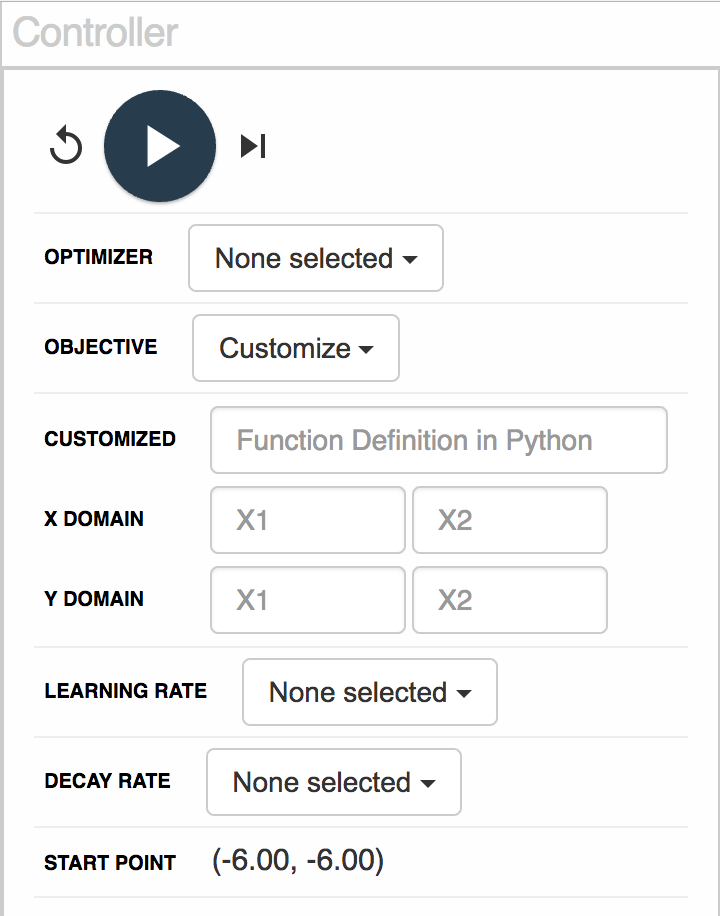
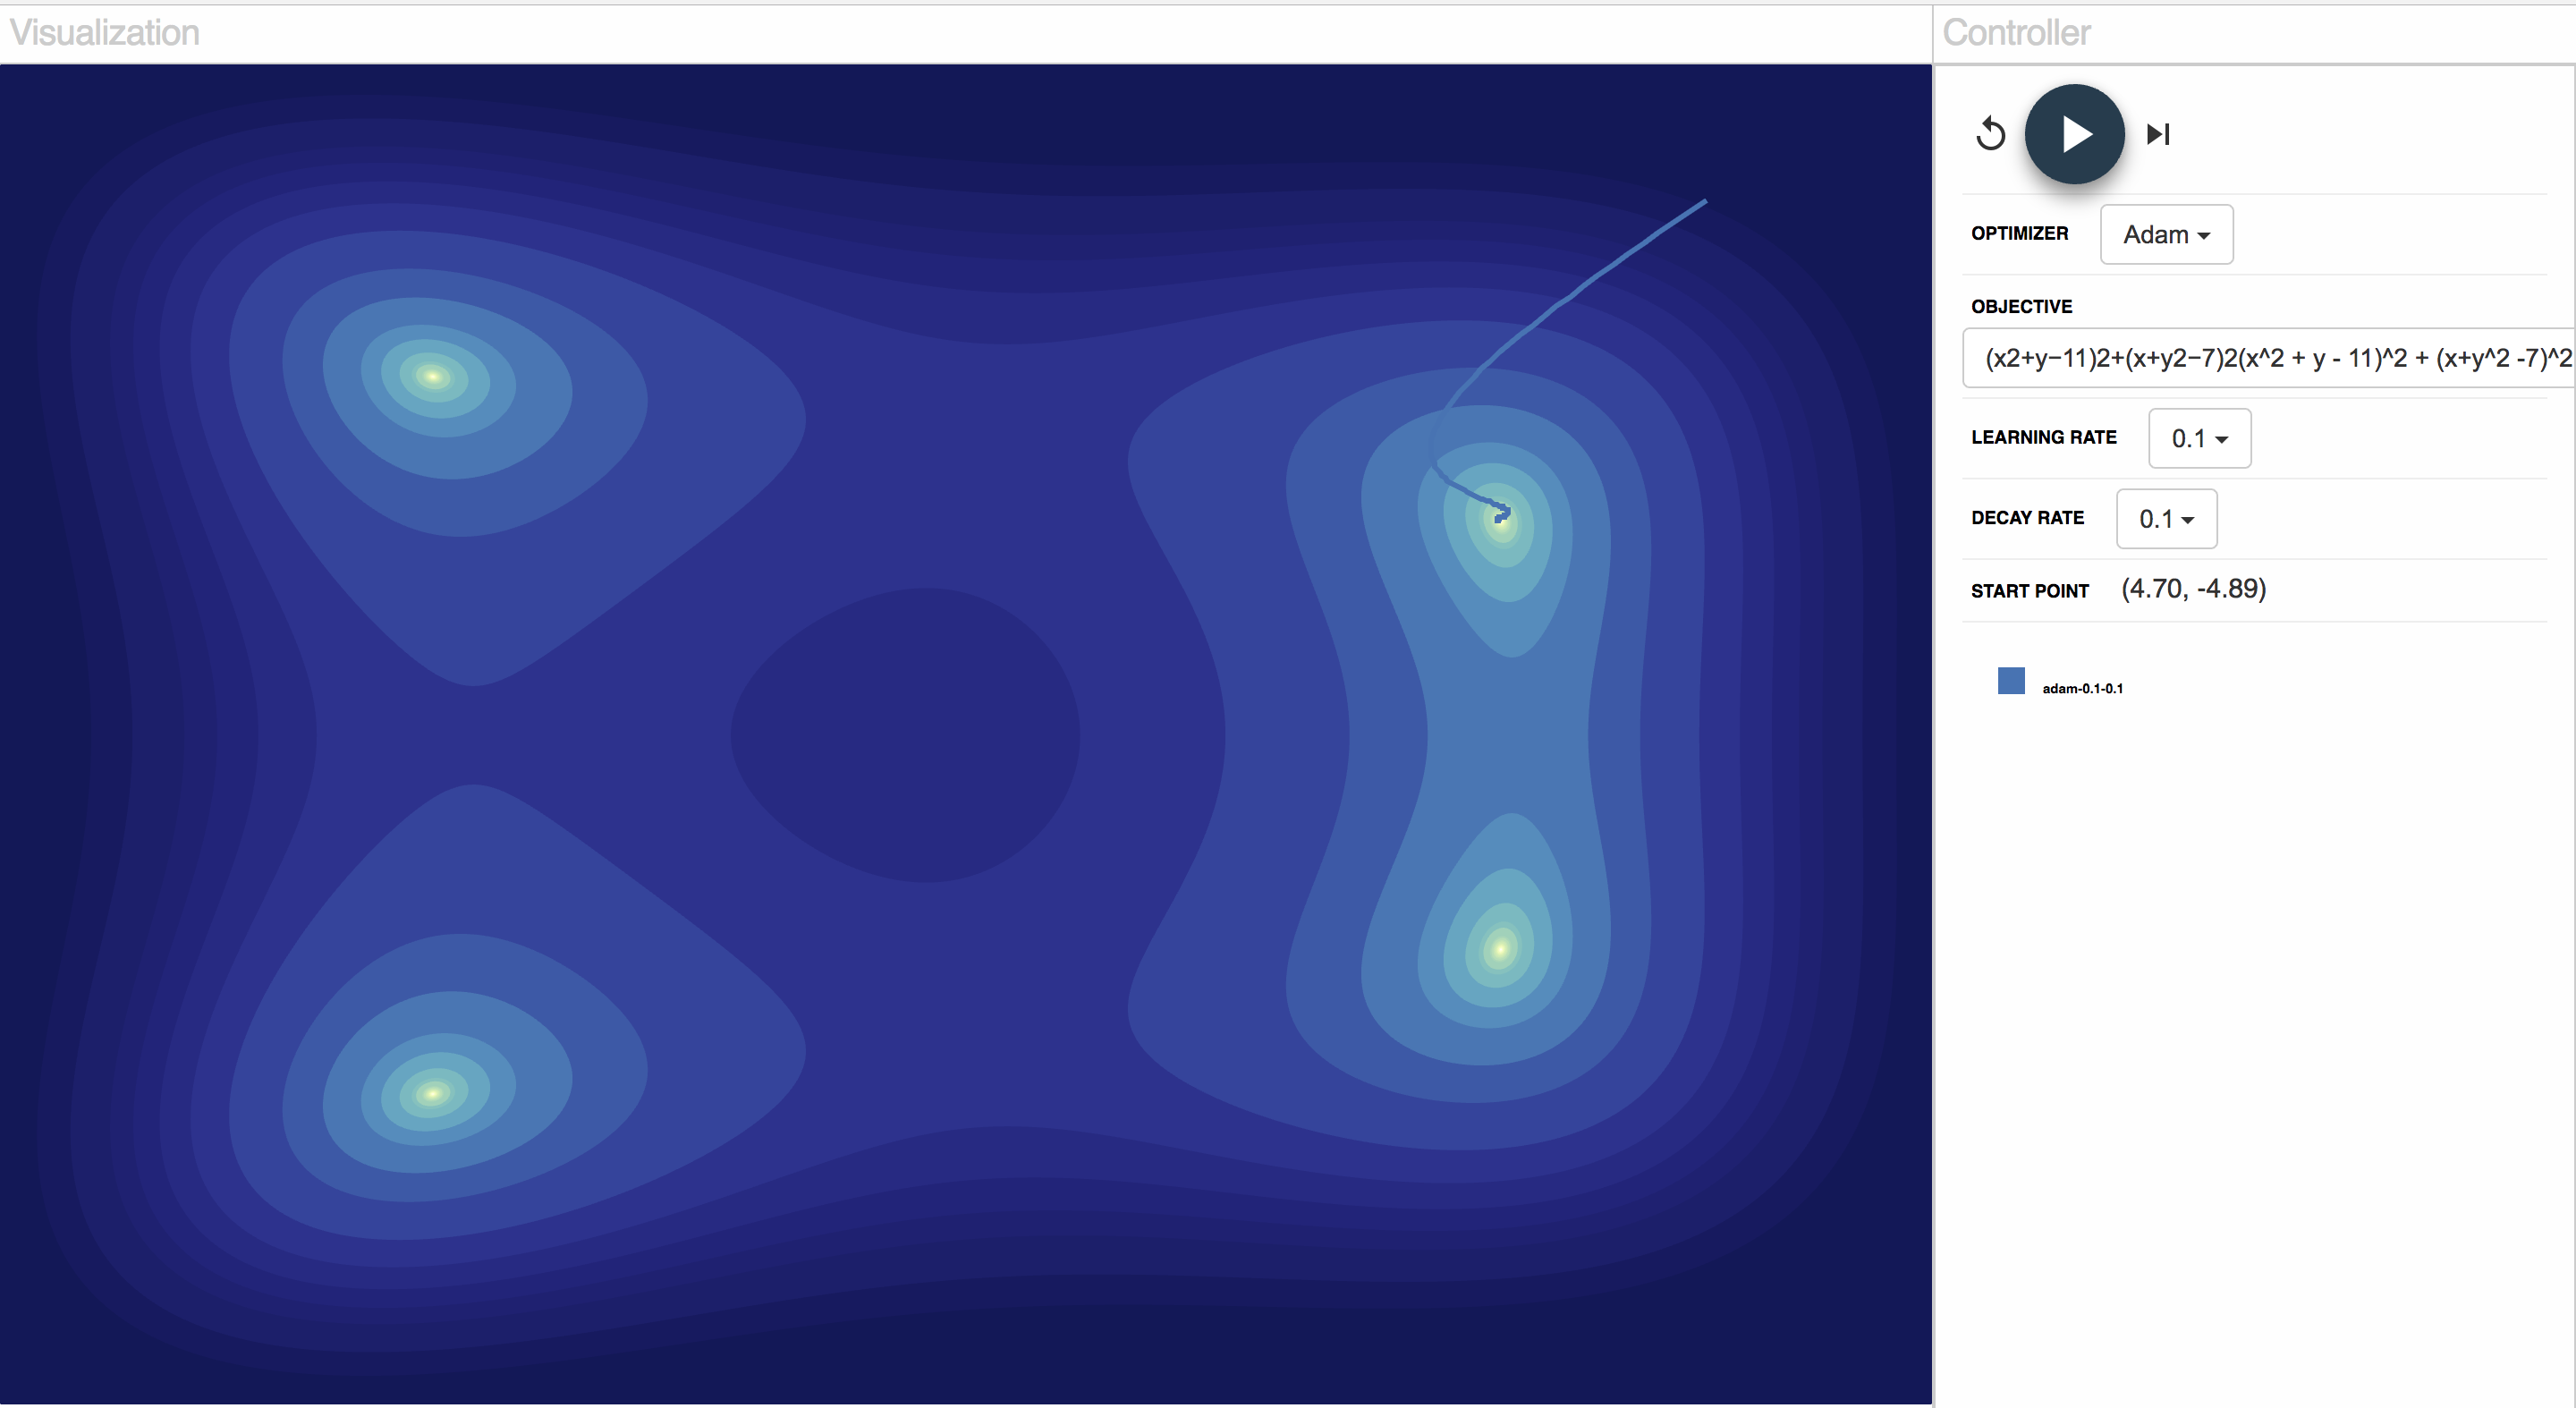
We choose two types of objective functions (convex and non-convex) to test with. We run each optimization algorithm on several typical example of each objective type, for each algorithm (flower function, Himmelblau function, banana function and matyas function), and compare different settings of hyperparameters. Also we support user-defined objectives/initialization and return real time results for users to try more experiments than those provided. And according to the user-defined objective function, we define the 2d contour of the function. As a result, the convergence process can be better visualized.
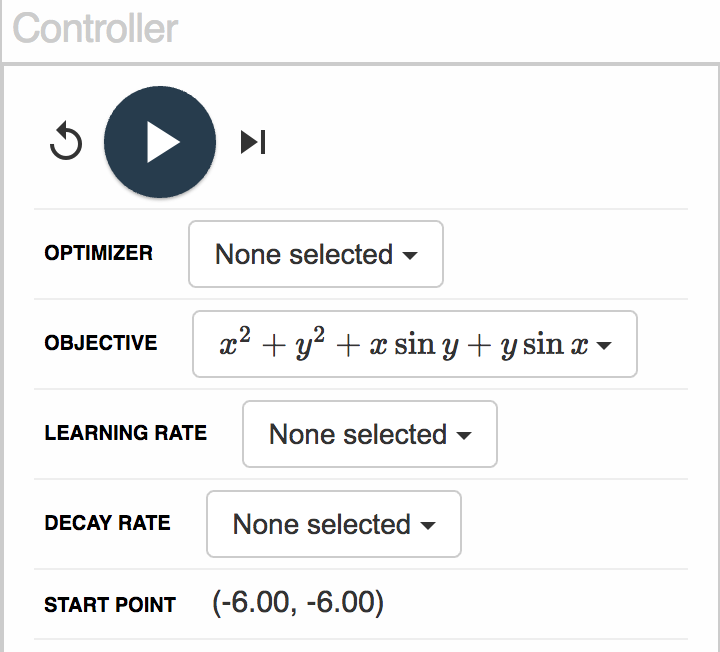
For the GUI part, we provide an web-based visual analytics system to give users a clear view of the behavior and properties of different optimization algorithms on different objectives, including analysis of the influence of hyperparameters and visual diagnosis of algorithm performance. It also support some extend of customization. For visualization, there are three important parts included for machine learning researchers to explore and interact with “Optimization Algorithms” and “Objective Functions”.
More interactions and views for researchers to select optimization algorithms and input their own objective functions effectively and efficiently.
Multiple and coordinated views are used to explore and compare different optimization algorithms on one specific objective function or different objective functions on one optimization algorithms. More visual clues/hints are showed to recommend researchers about the status of searching loops, which would be better for researchers to diagnose the relevant optimization algorithm.
All parameters can be set in the interface as well as customizing objective functions.
We choose two types of objective functions (convex and non-convex) to test with. We run each optimization algorithm on several typical example of each objective type, for each algorithm (flower function, Himmelblau function, banana function and matyas function), and compare different settings of hyperparameters. Also we support user-defined objectives/initialization and return real time results for users to try more experiments than those provided. And according to the user-defined objective function, we define the 2d contour of the function. As a result, the convergence process can be better visualized.
For the GUI part, we provide an web-based visual analytics system to give users a clear view of the behavior and properties of different optimization algorithms on different objectives, including analysis of the influence of hyperparameters and visual diagnosis of algorithm performance. It also support some extend of customization. For visualization, there are three important parts included for machine learning researchers to explore and interact with “Optimization Algorithms” and “Objective Functions”.
More interactions and views for researchers to select optimization algorithms and input their own objective functions effectively and efficiently.
Multiple and coordinated views are used to explore and compare different optimization algorithms on one specific objective function or different objective functions on one optimization algorithms. More visual clues/hints are showed to recommend researchers about the status of searching loops, which would be better for researchers to diagnose the relevant optimization algorithm.
All parameters can be set in the interface as well as customizing objective functions.
Sample Results
Next, We used the GUI built to study the effect of different factors, including the convexity of objectives, optimizers, learning rate, weight decay, initialization
Compare objectives
We run Adam with same learning rates and initialization on a flower function and Himmelblan’s function.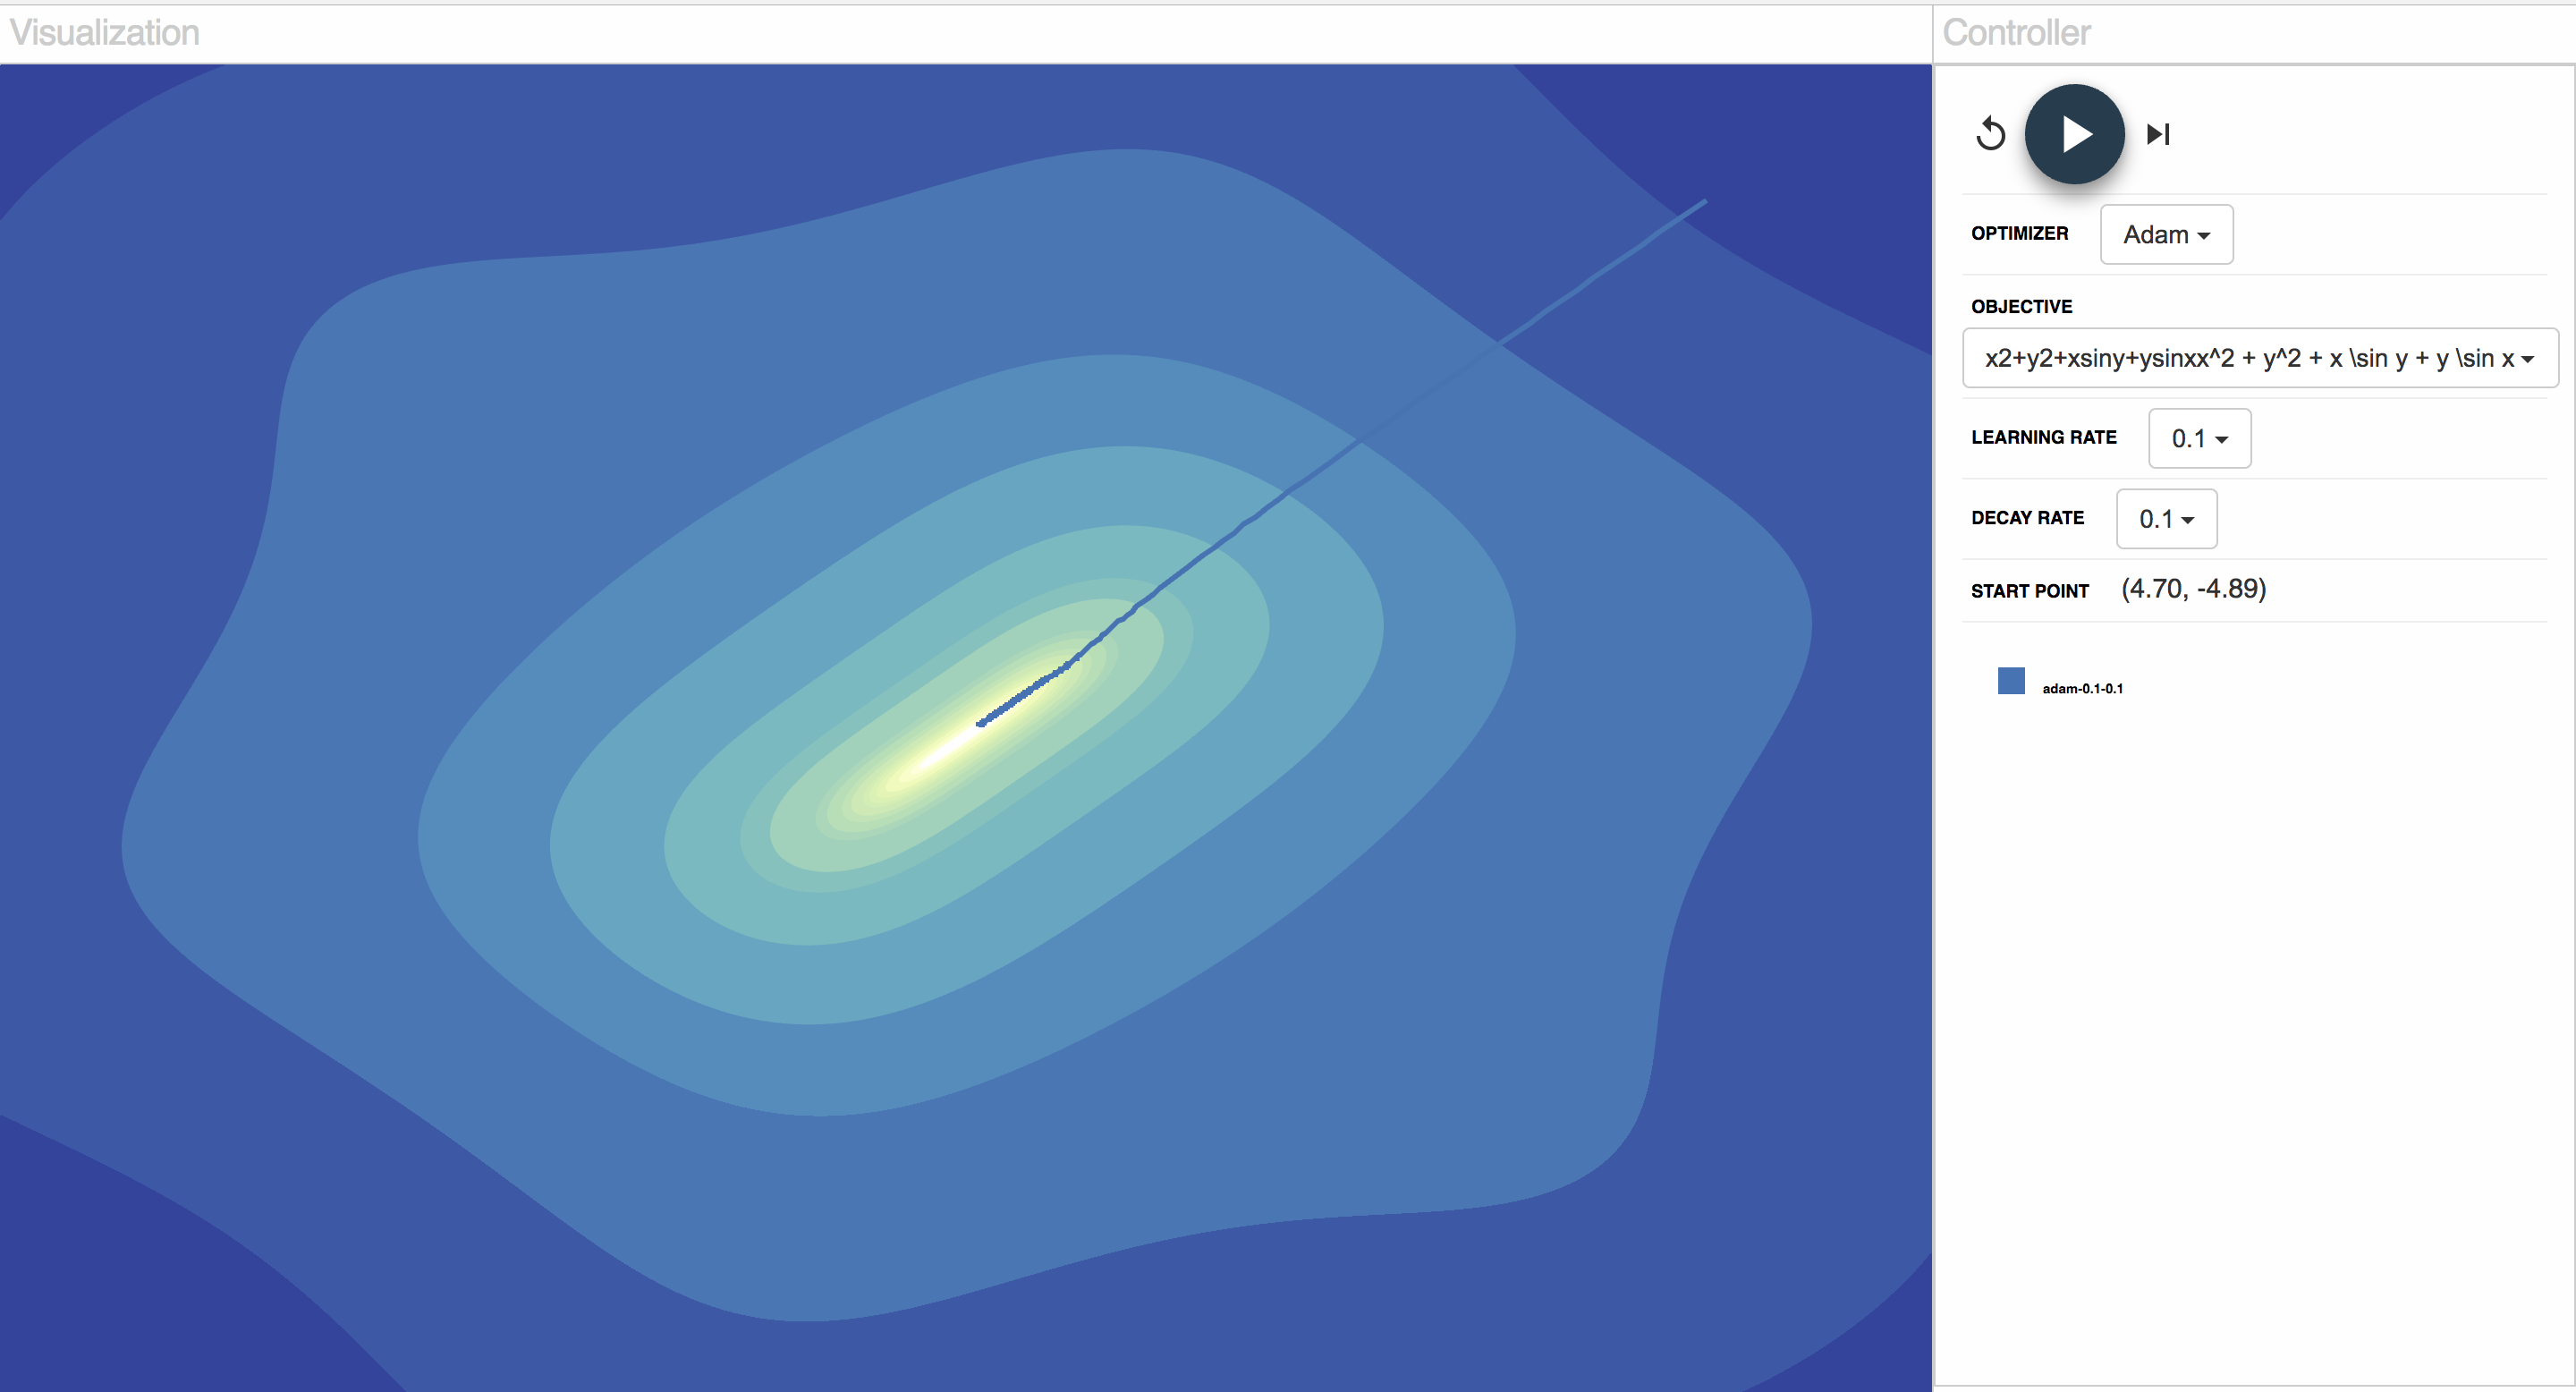
Compare optimizers
We run Adam and RMSprop with same learning rates and initialization on same objective function.
Compare learning rates
We run Adam with different learning rates (1 and 0.003) but same initialization and objective function.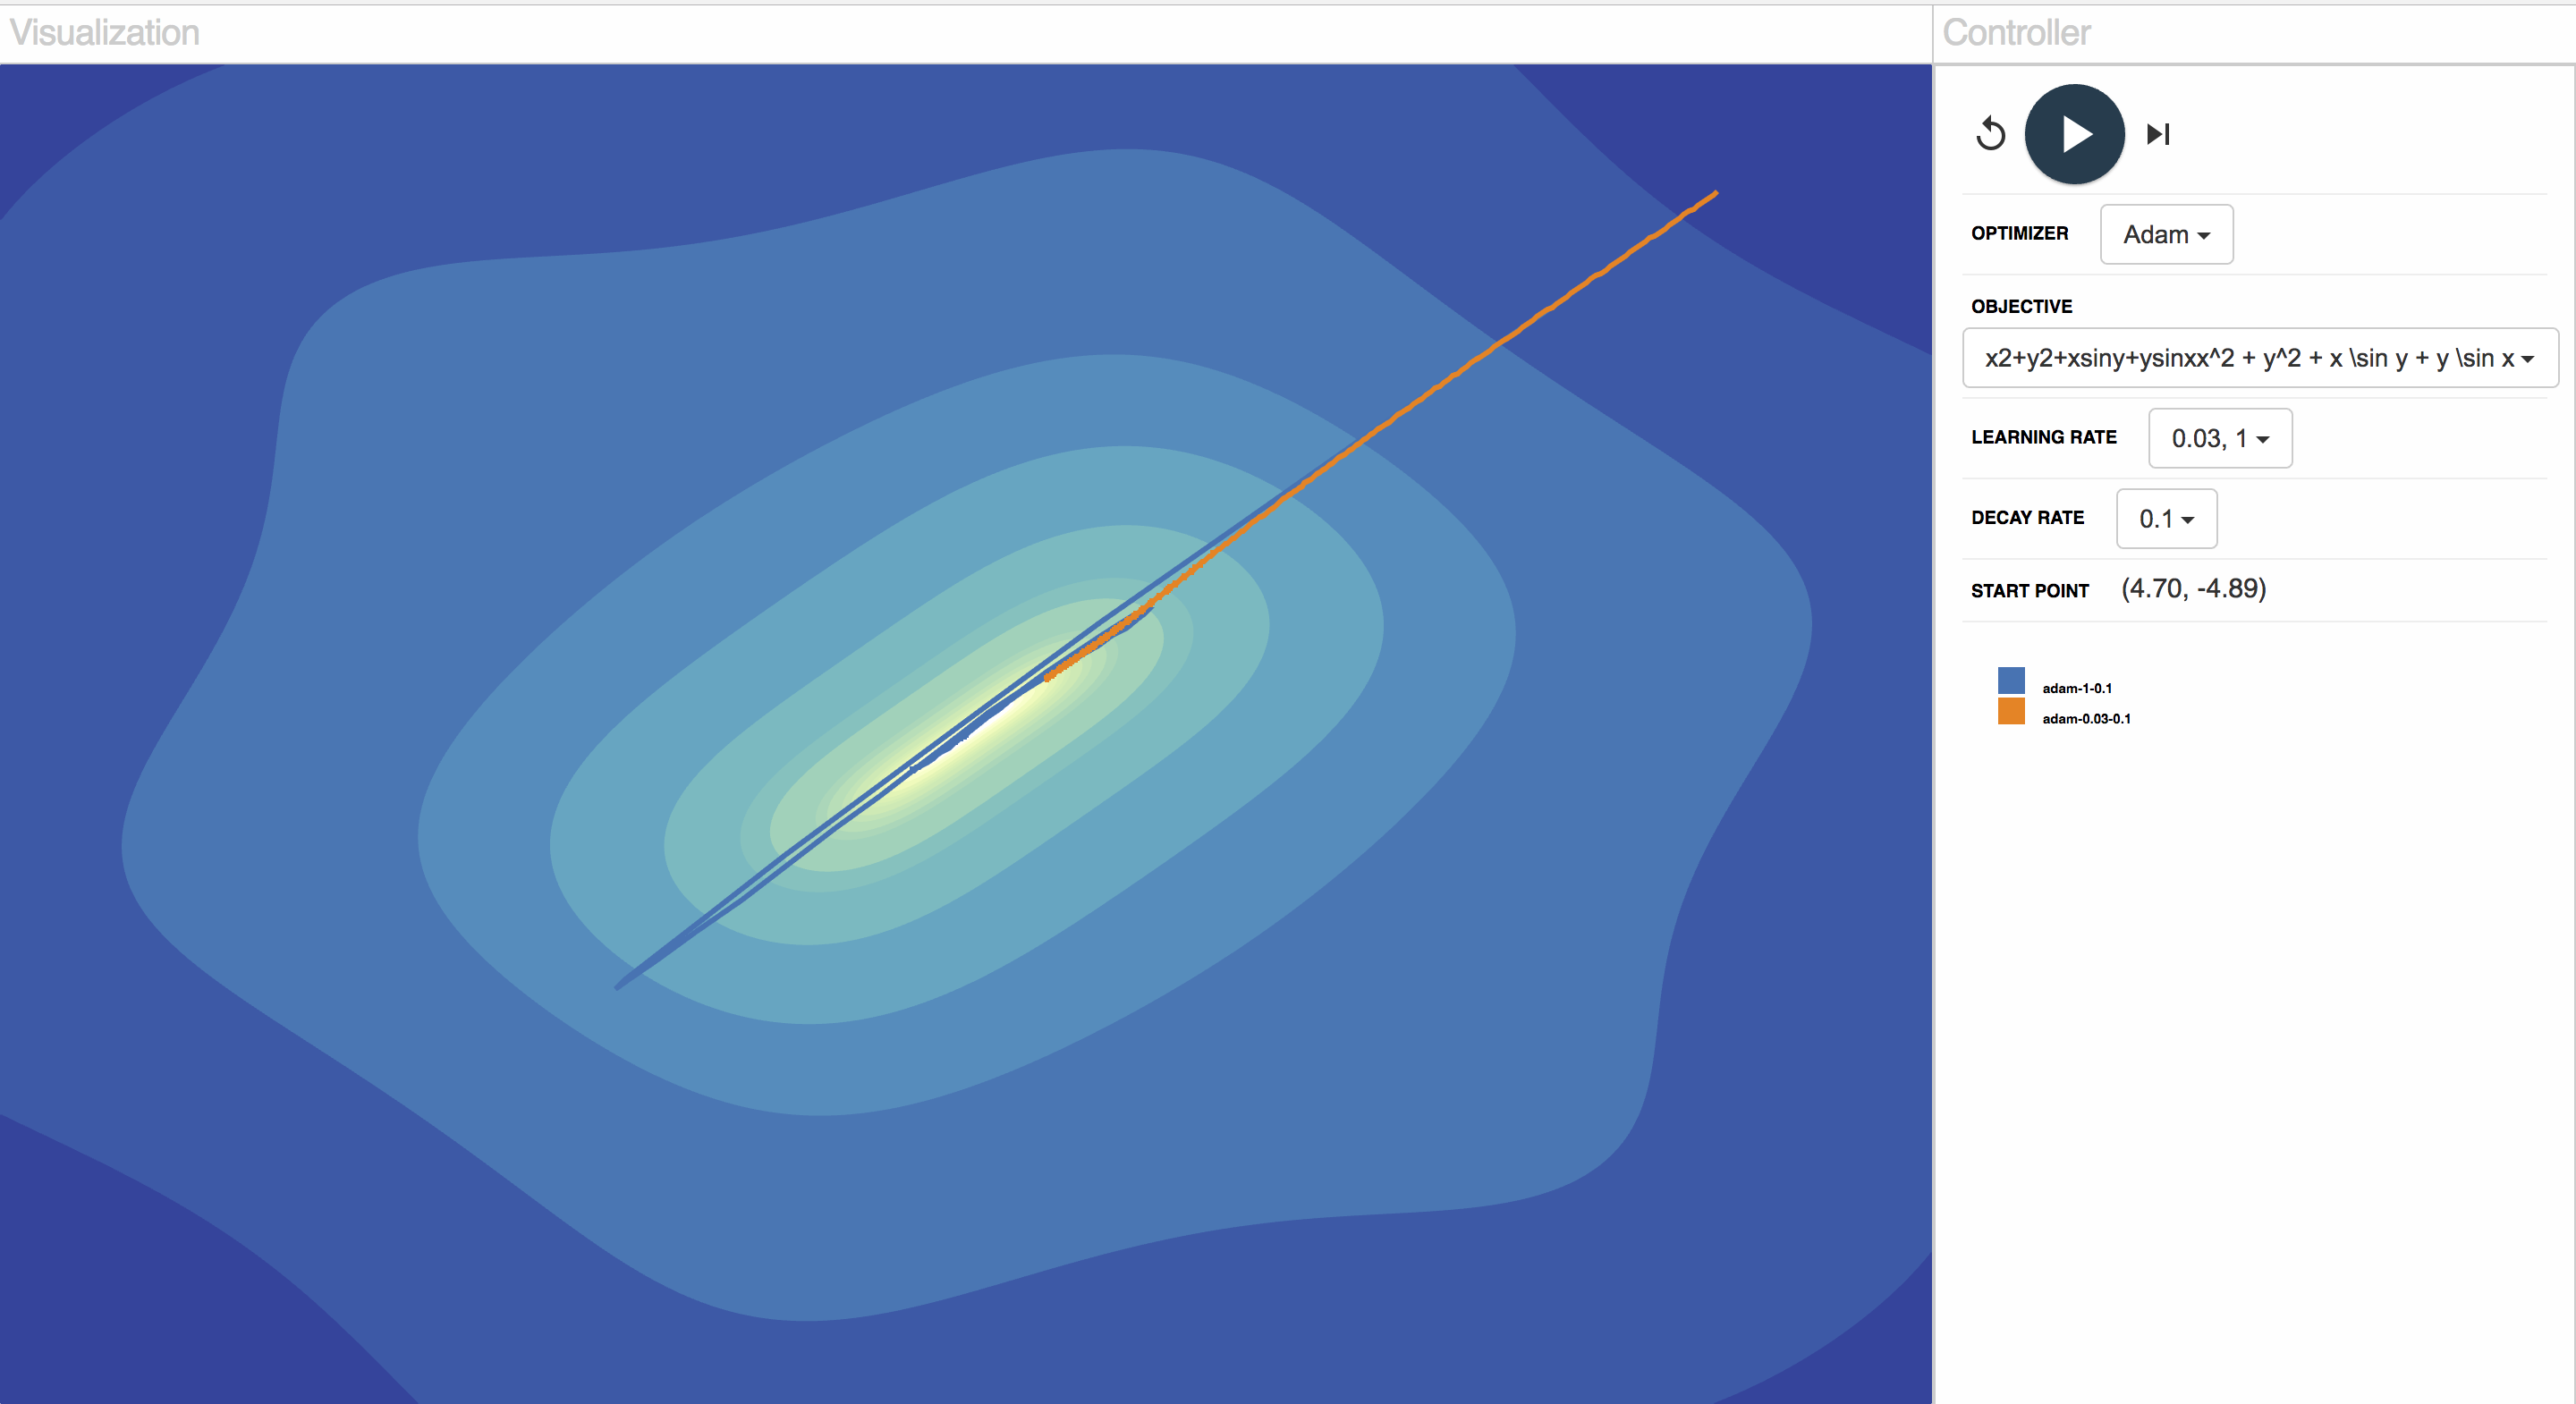
Compare weight decay
We run RMSprop on a non-convex function, with weight decay = 0.00001 vs. weight decay = 0.1.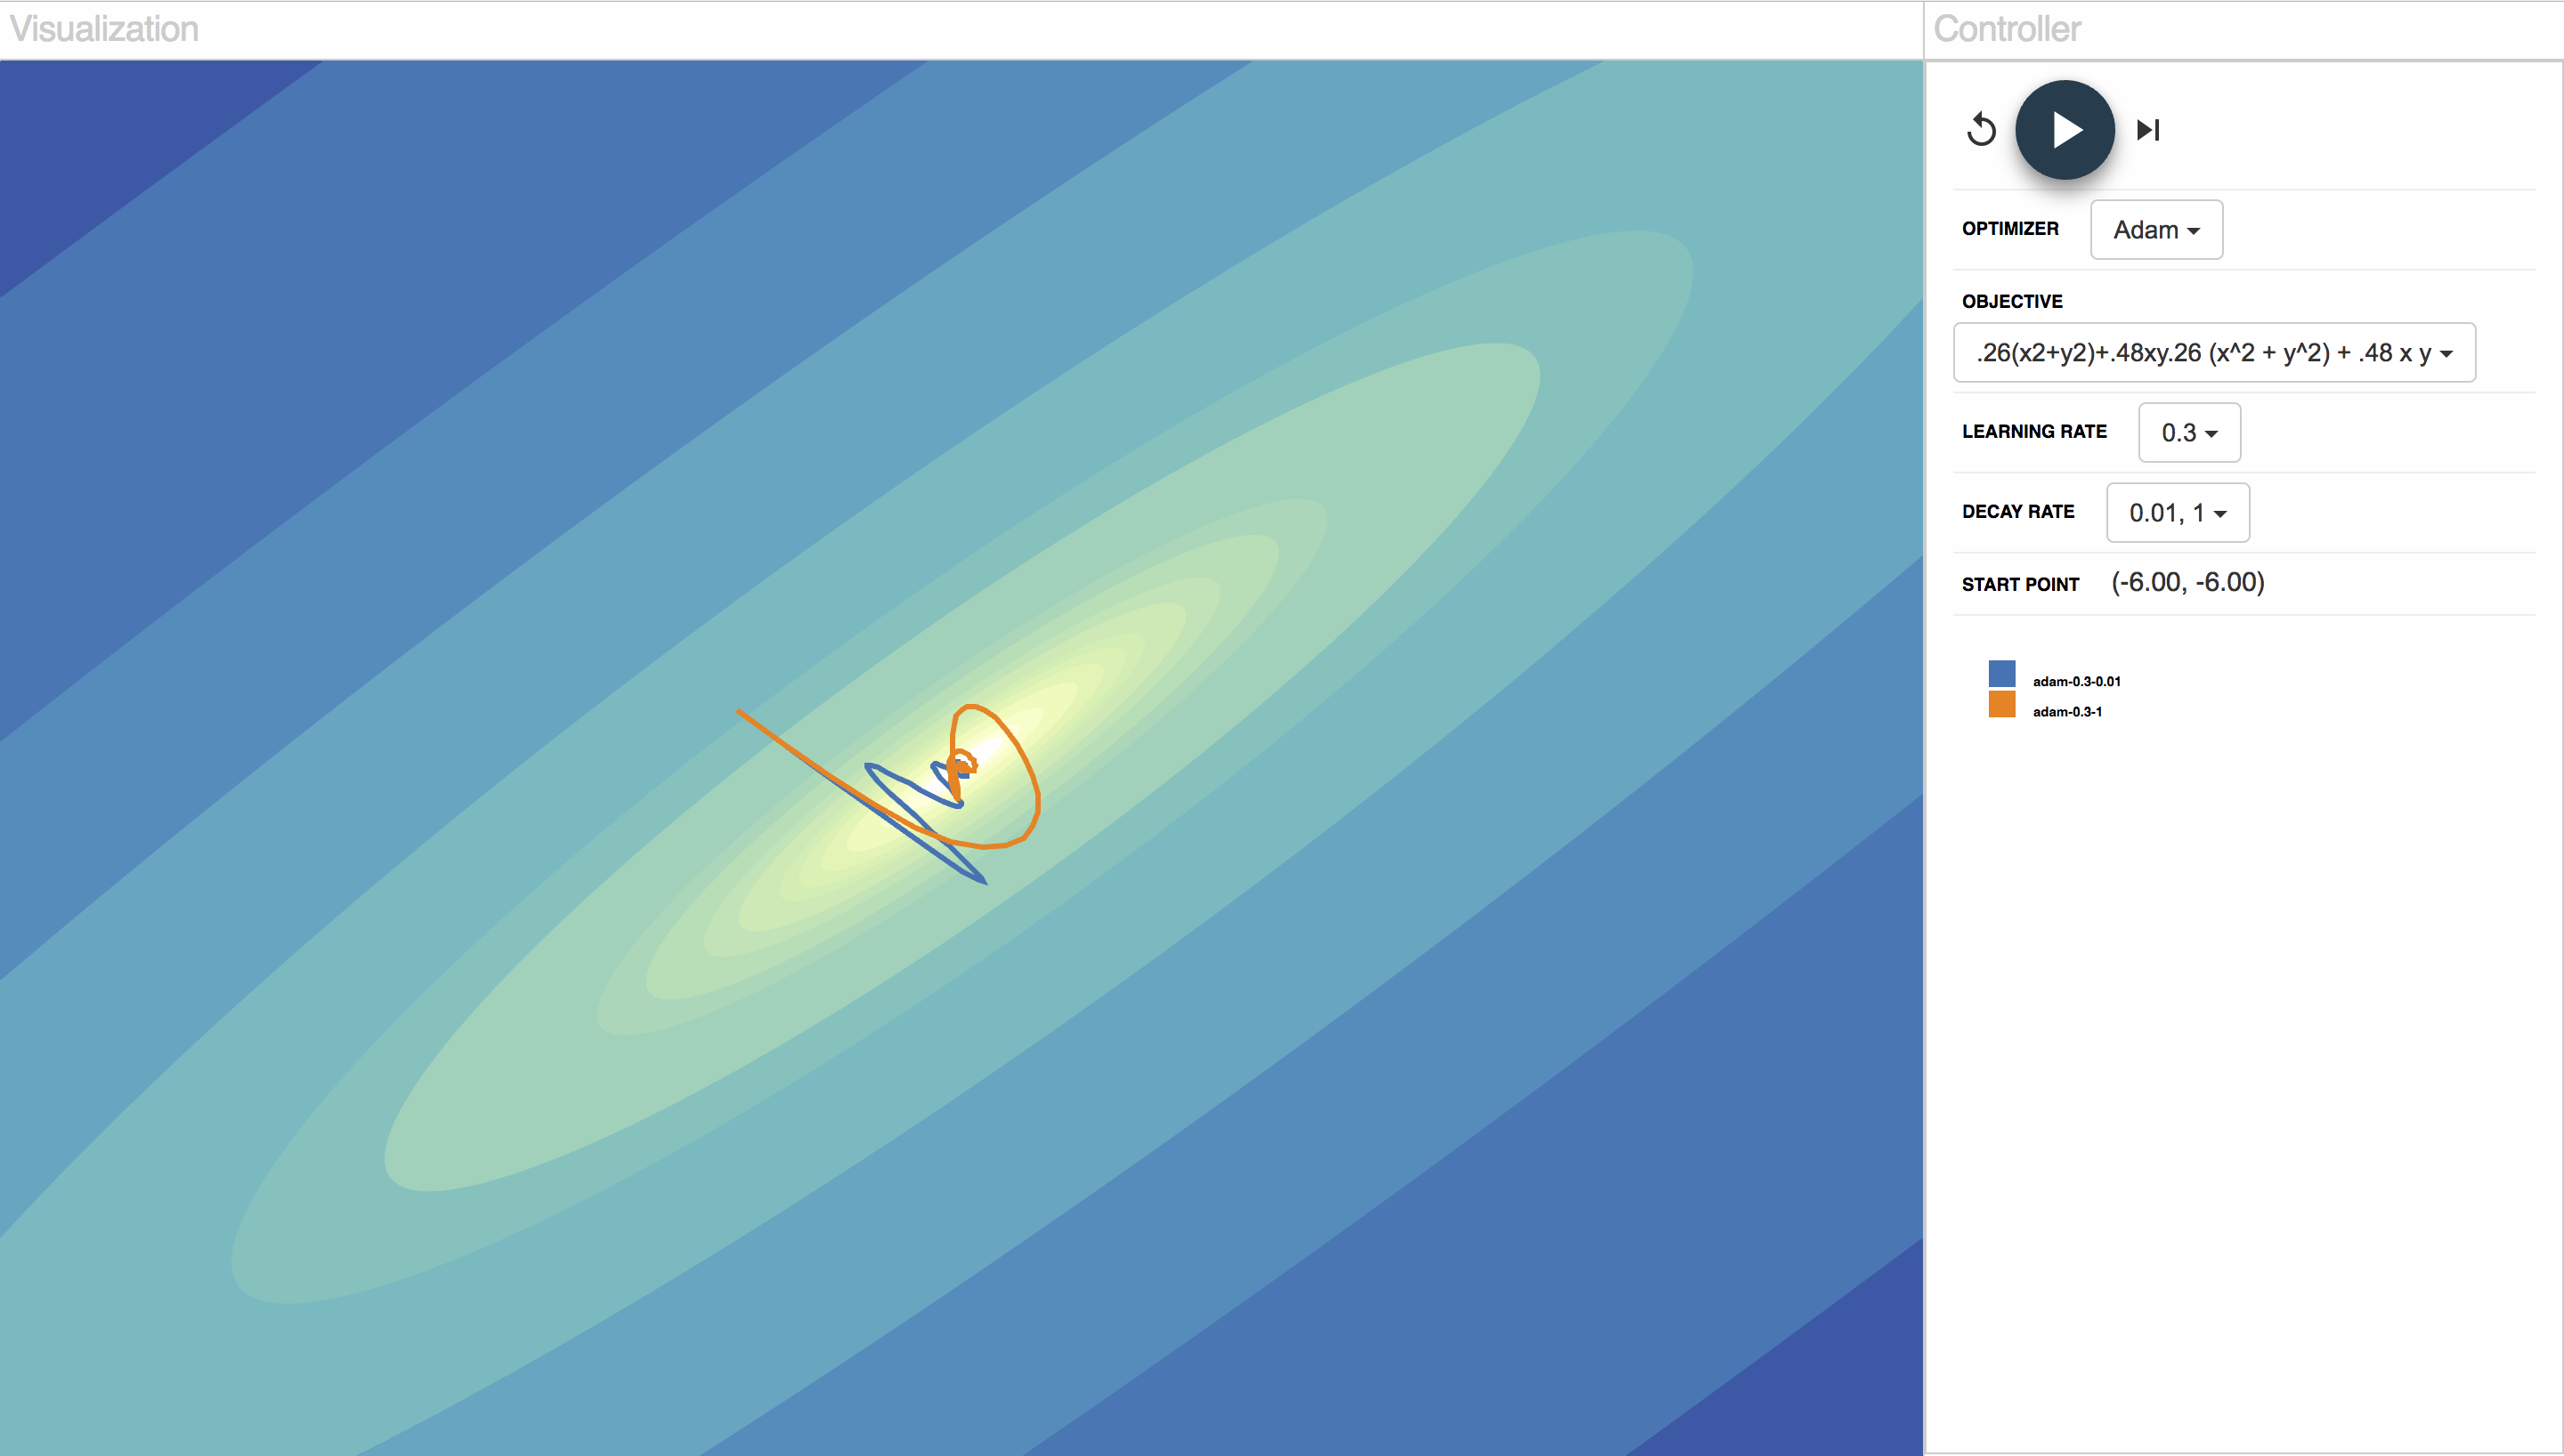
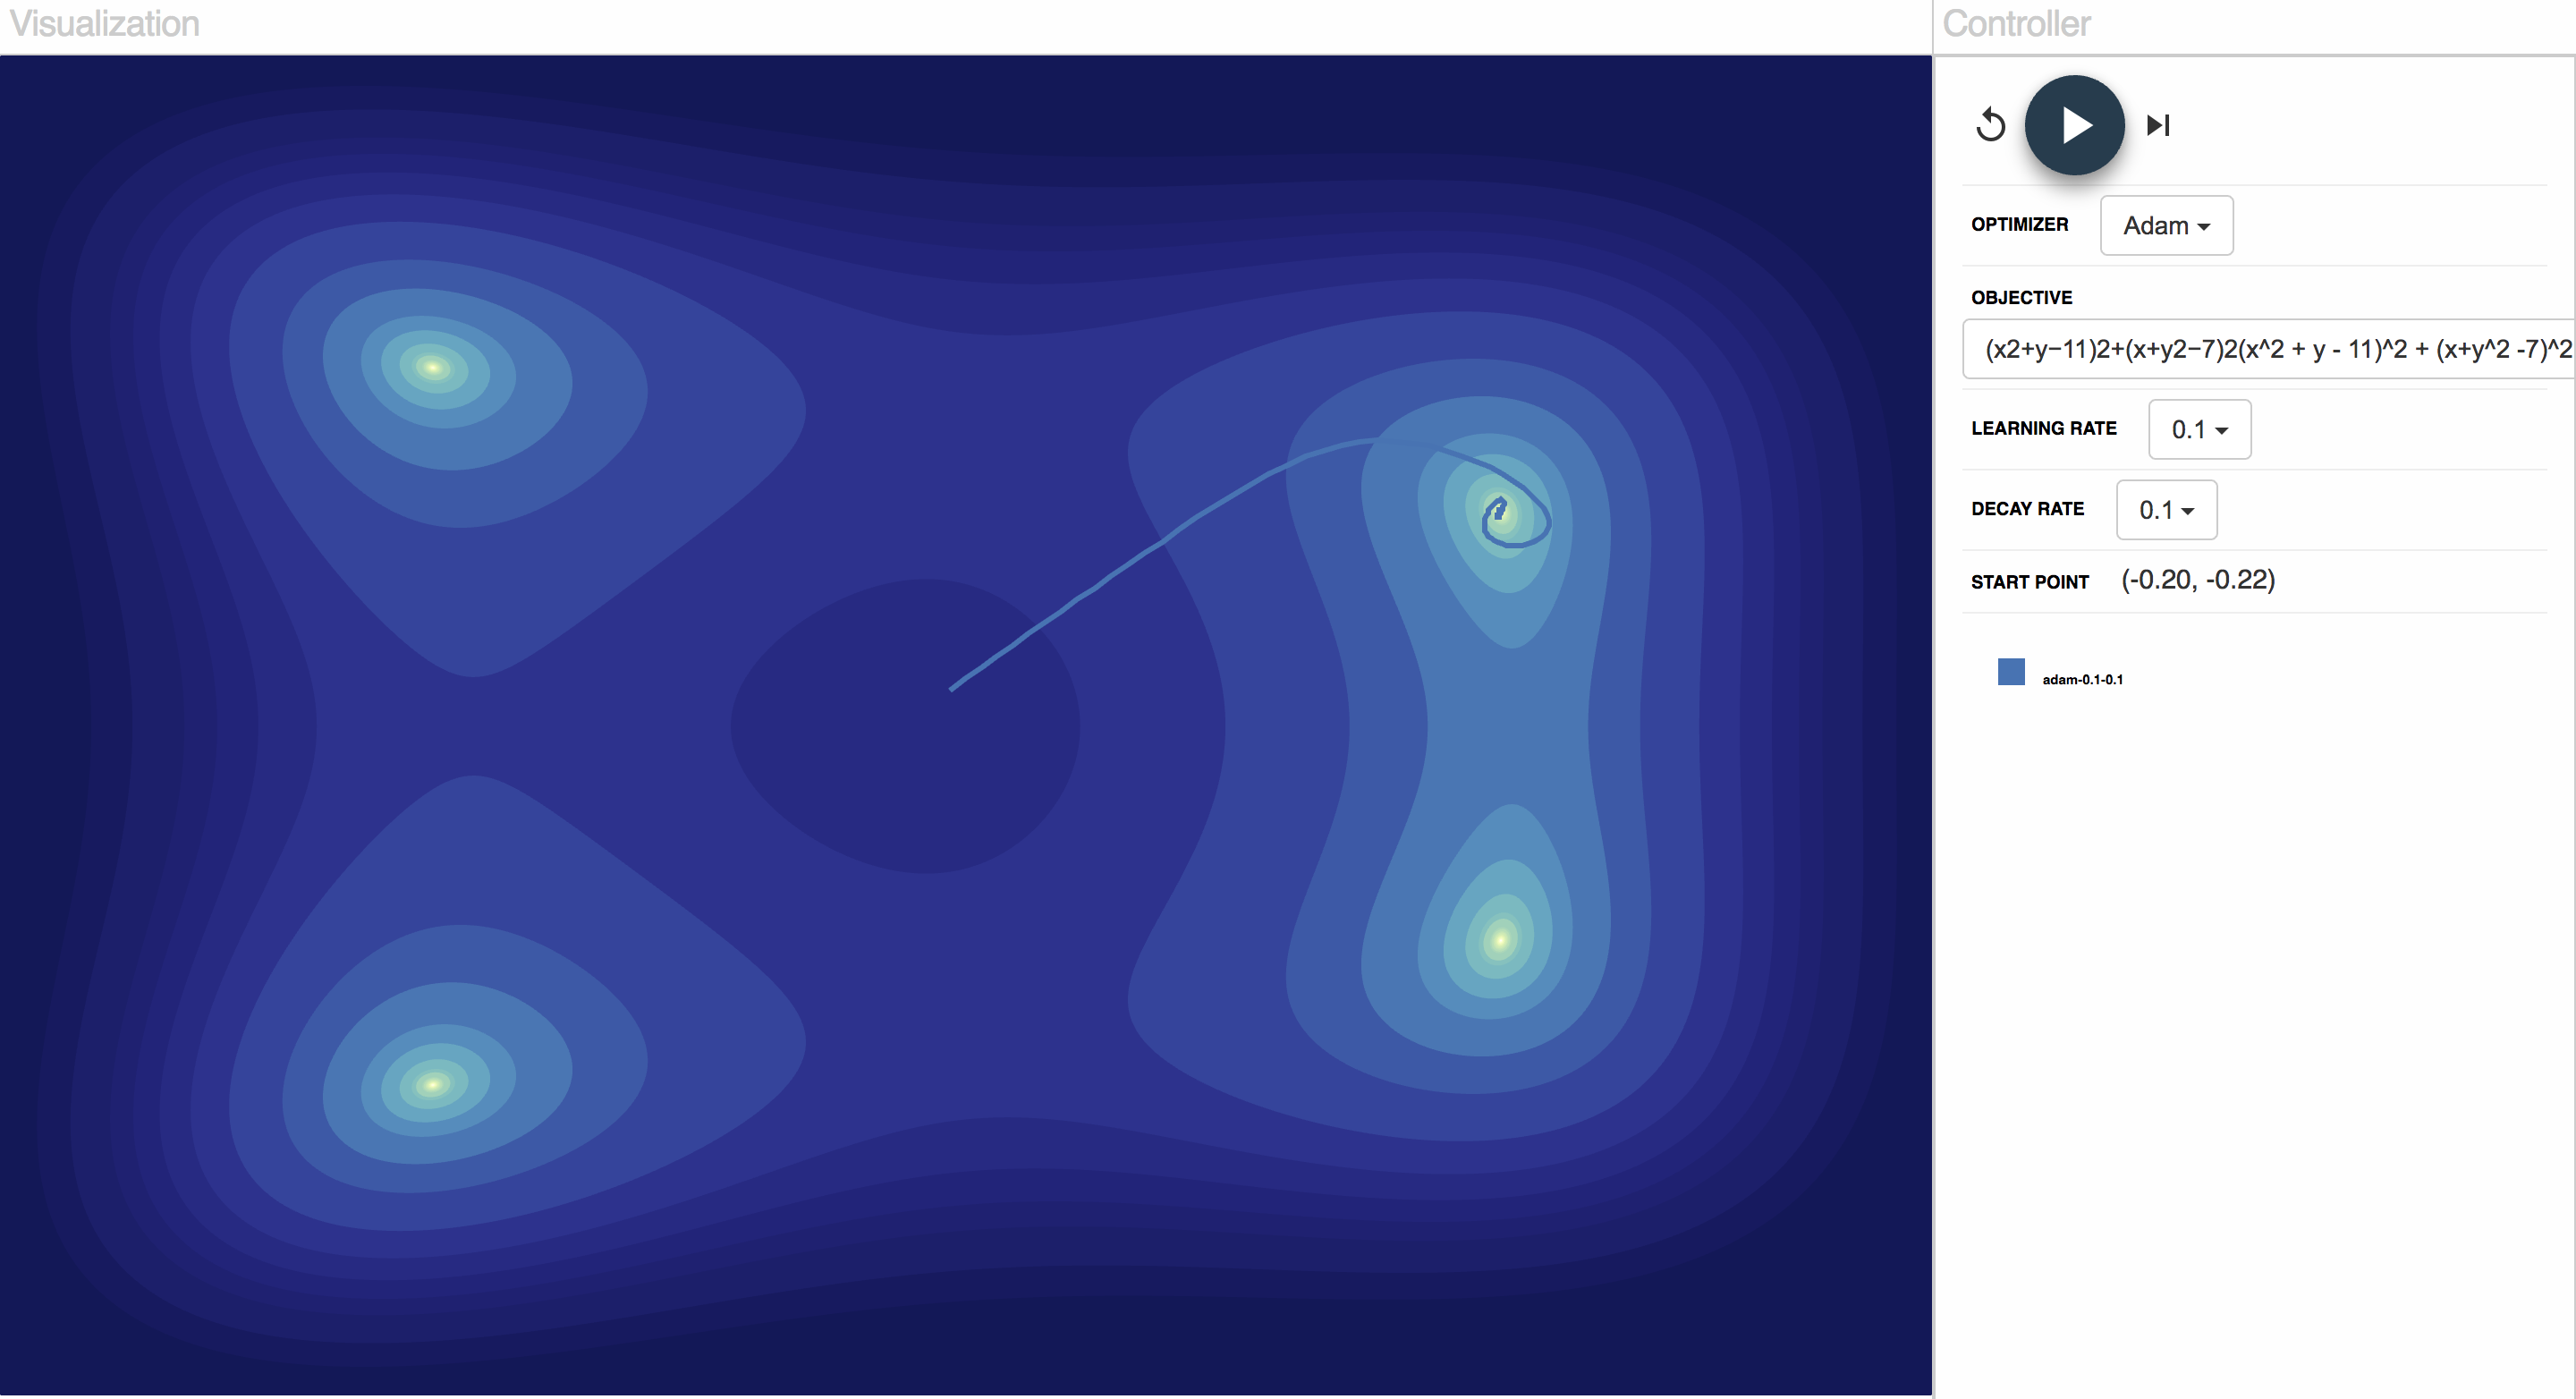
Compare Initialization
We run Adam with different initialization on a non-convex function.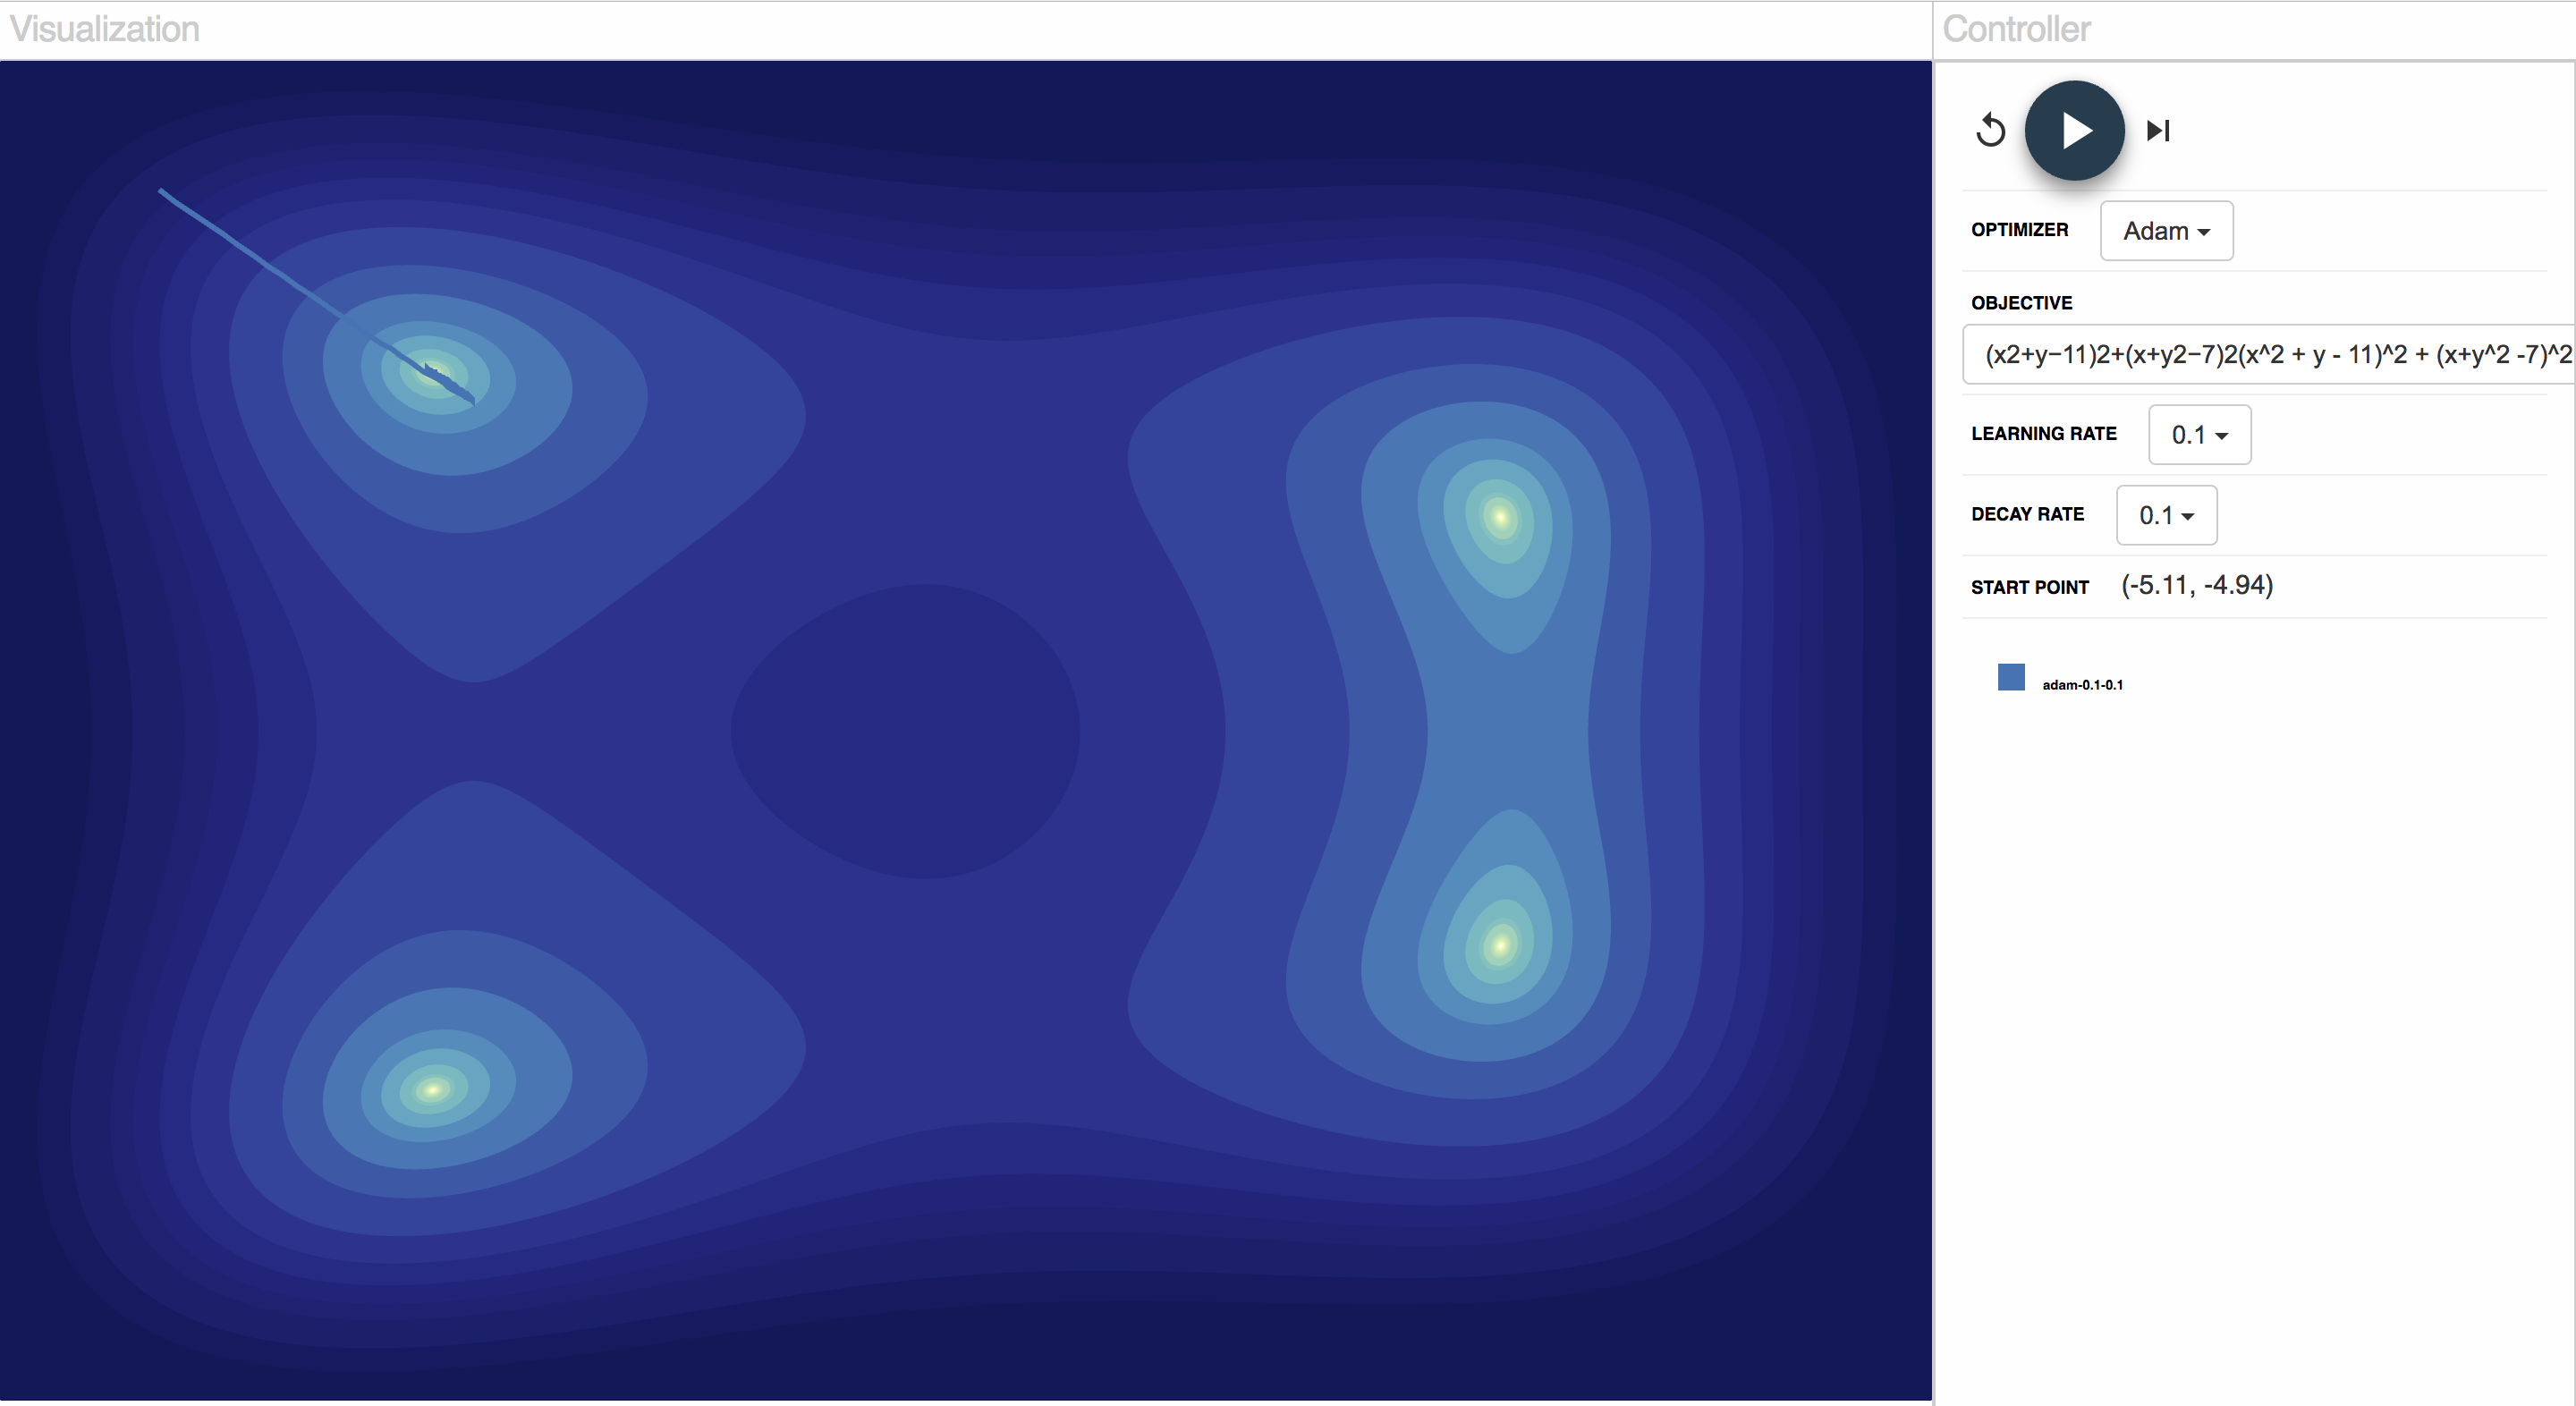
Compare momentum
We run RMSprop on a non-convex function without momentum vs. momentum = 0.01.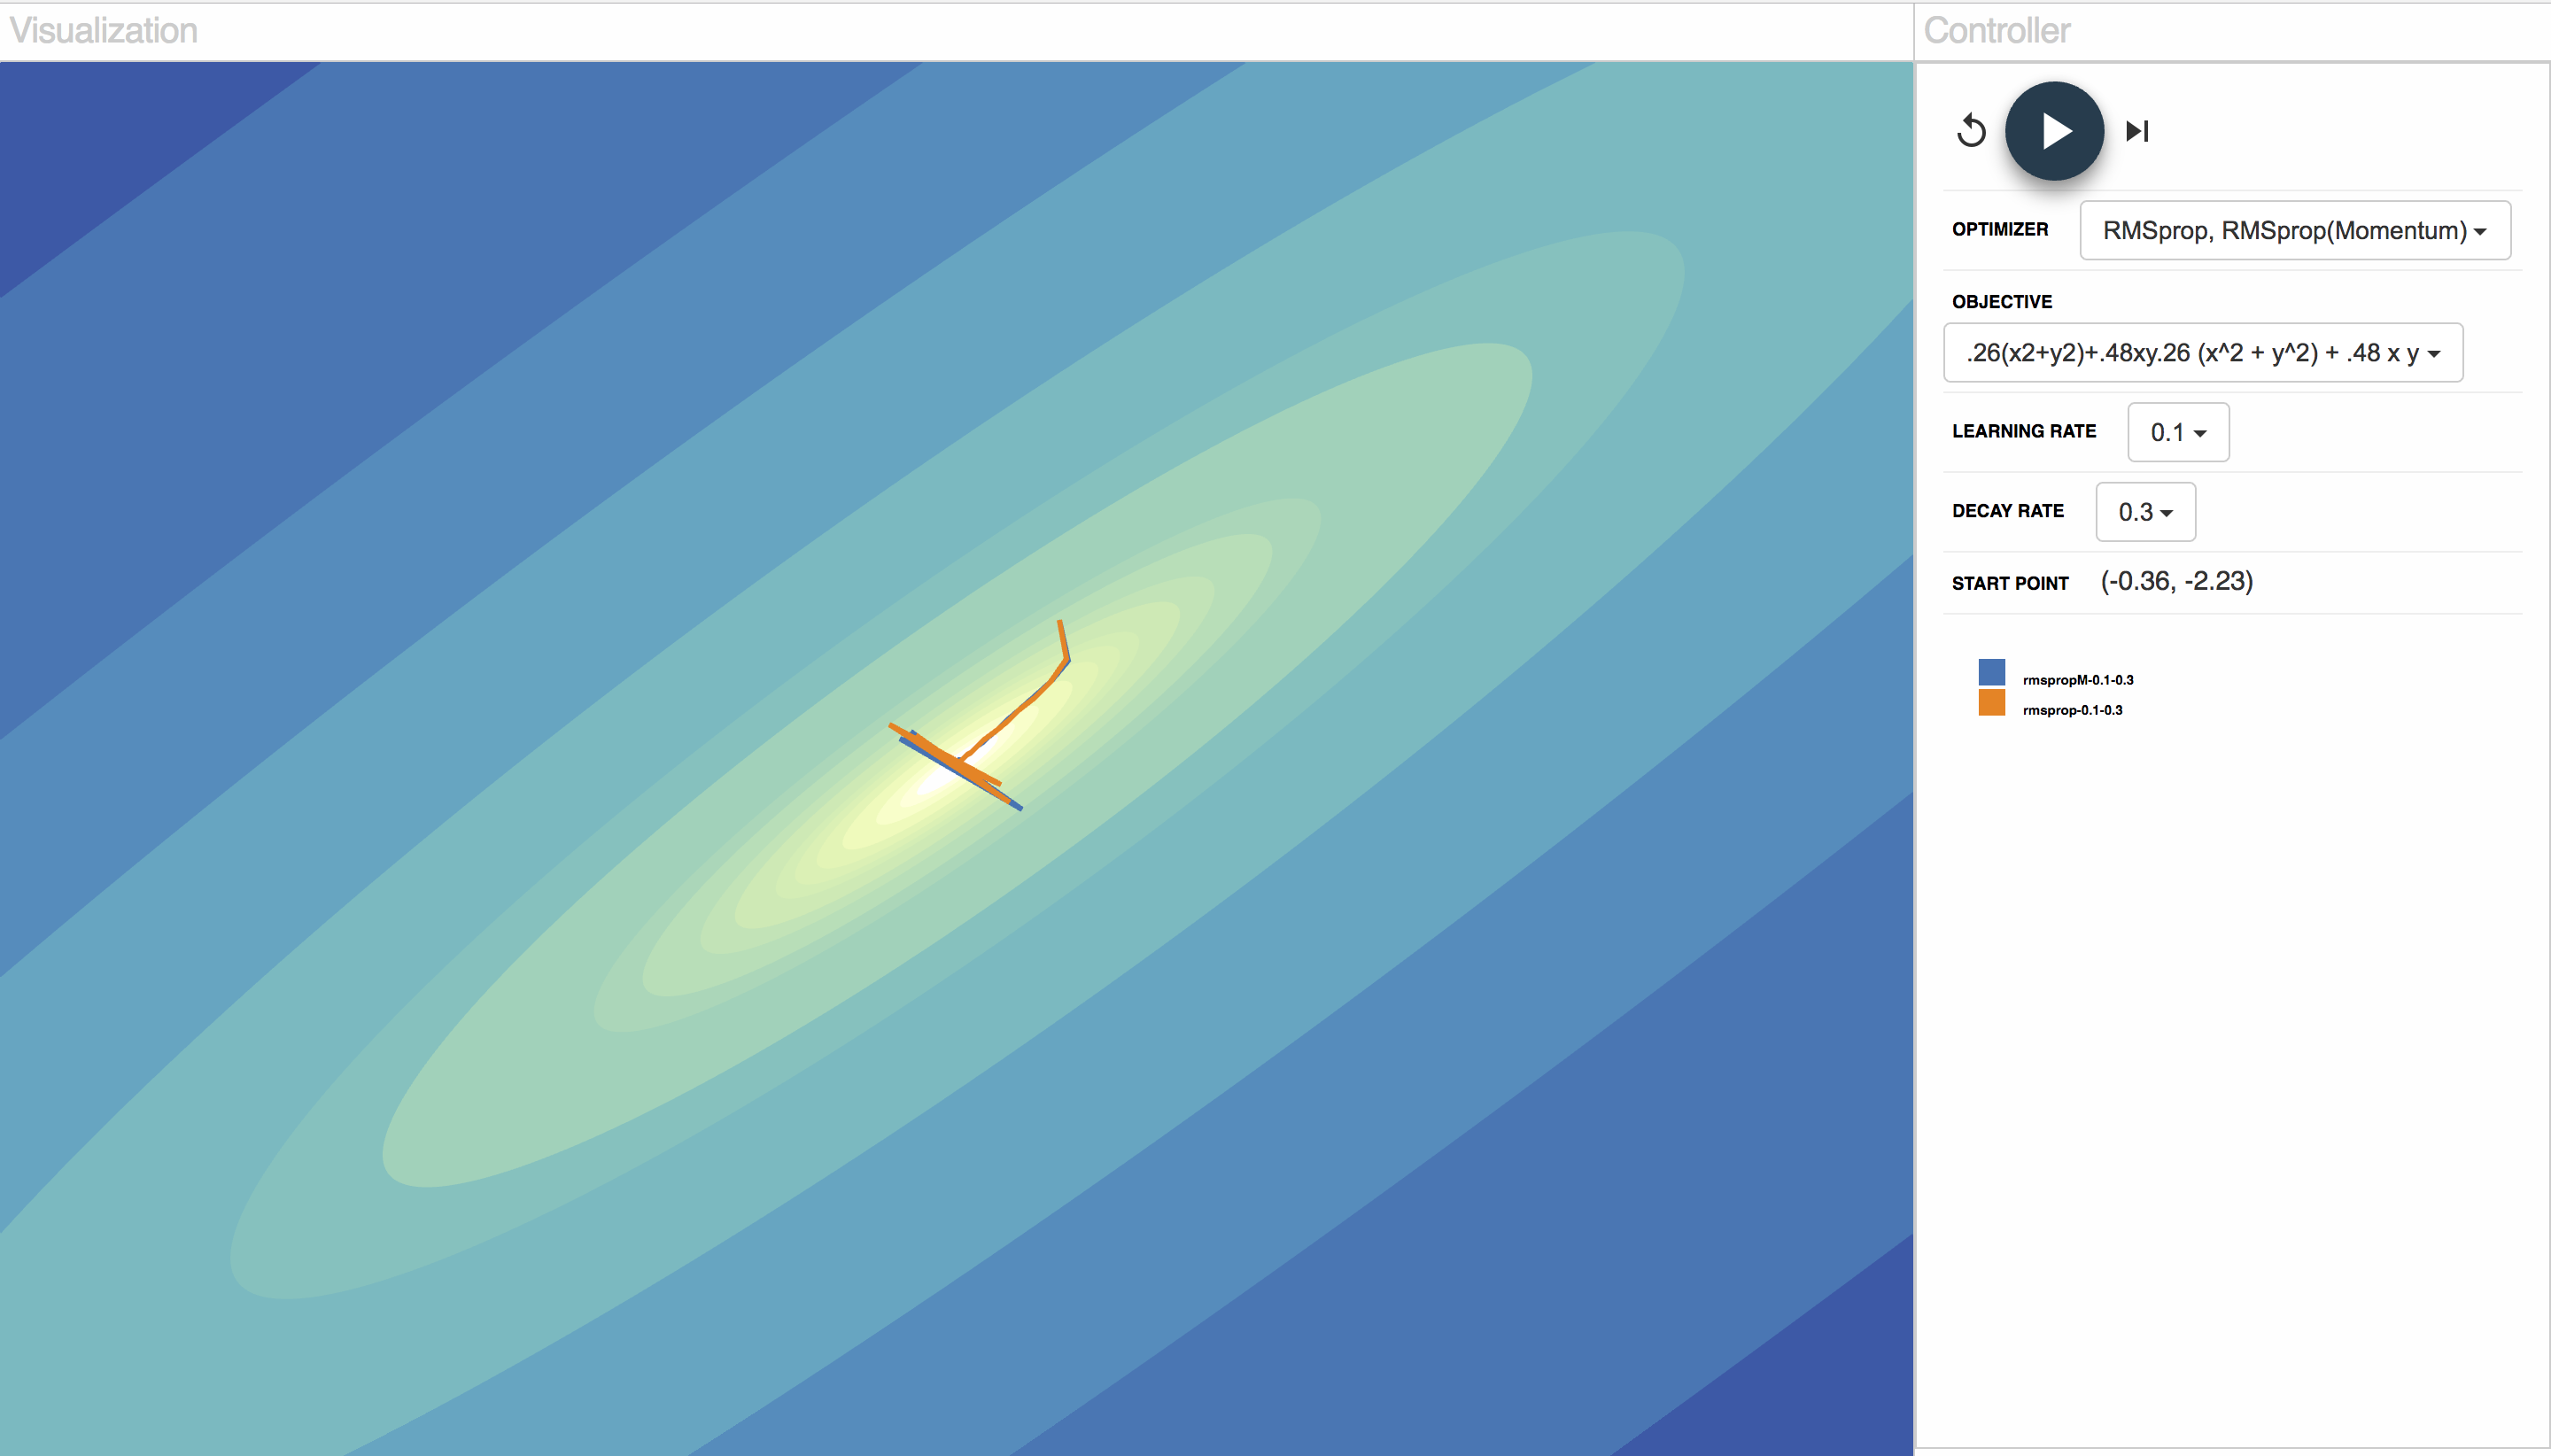
Reference
[1] Boyd, Stephen, and Lieven Vandenberghe. Convex optimization. Cambridge university press,
2004.
Kingma, Diederik P., and Jimmy Ba. "Adam: A method for stochastic optimization." arXiv preprint
arXiv:1412.6980(2014).
[2] Zeiler, Matthew D. "ADADELTA: an adaptive learning rate method." arXiv preprint arXiv:1212.5701
(2012).
[3] Acerbi, L. & Ma, W. J. (2017). Practical Bayesian Optimization for Model Fitting with Bayesian
Adaptive Direct Search. arXiv preprint, arXiv:1705.04405.
[4] Visualize optimization algorithms in MATLAB: https://github.com/lacerbi/optimviz [5]Visualizing and Animating Optimization Algorithms with Matplotlib:
http://tiao.io/notes/visualizing-and-animating-optimization-algorithms-with-matplotlib/
[6] An Interactive Tutorial on Numerical Optimization:
http://www.benfrederickson.com/numerical-optimization/
[7] Virtual Library of Simulation Experiments: https://www.sfu.ca/~ssurjano/optimization.html
[8] Sebastian Ruder “An overview of gradient descent optimization algorithms∗” arXiv:1609.04747
Blog:http://ruder.io/optimizing-gradient-descent/